Contents
- Overview — what’s your stack actually costing you?
- Sessions — find the session that ate your context
- Stats — when are you actually spending?
- Quota — never get surprised by a limit again
- Statusline — see the cost while you can still do something about it
- A real lifecycle, not a static script
- What it deliberately does not do
- Try it
- Comments
If you drive more than one AI coding agent from the terminal — Codex, Claude Code, Antigravity, OpenCode, Gemini CLI, Pi, Kimi, the rest — you already know the problem: each one writes its own session logs in its own format, and none of them tell you what any of it cost. Tokdash (repo) reads those logs and gives you one local dashboard for all of them: tokens, USD cost, prompt-cache hit rate, per-session drill-down, and quota resets across Codex / Claude Code / Antigravity.
It runs entirely on 127.0.0.1. No telemetry, no account, no upload — just a FastAPI server that parses the JSONL/SQLite files the agents already write. Install is two lines:
1
2
3
pipx install tokdash
tokdash setup
# → open http://127.0.0.1:55423
Try it without installing on the live demo — same frontend, synthetic data, every tab and every theme.
This post walks through what each tab actually does, in pictures and in words.
Performance footnote: the local SQLite usage index keeps a year of history searchable in under a second on cold scans. ~30× faster than pre-0.6 cold scans, ~15× faster than
ccusageon the same hardware in the same local benchmark. Source logs remain the source of truth — the DB is a local performance index only.
Overview — what’s your stack actually costing you?
The Overview tab answers the three questions most people want first: how much did I spend, which model is the culprit, and which tool is heaviest?
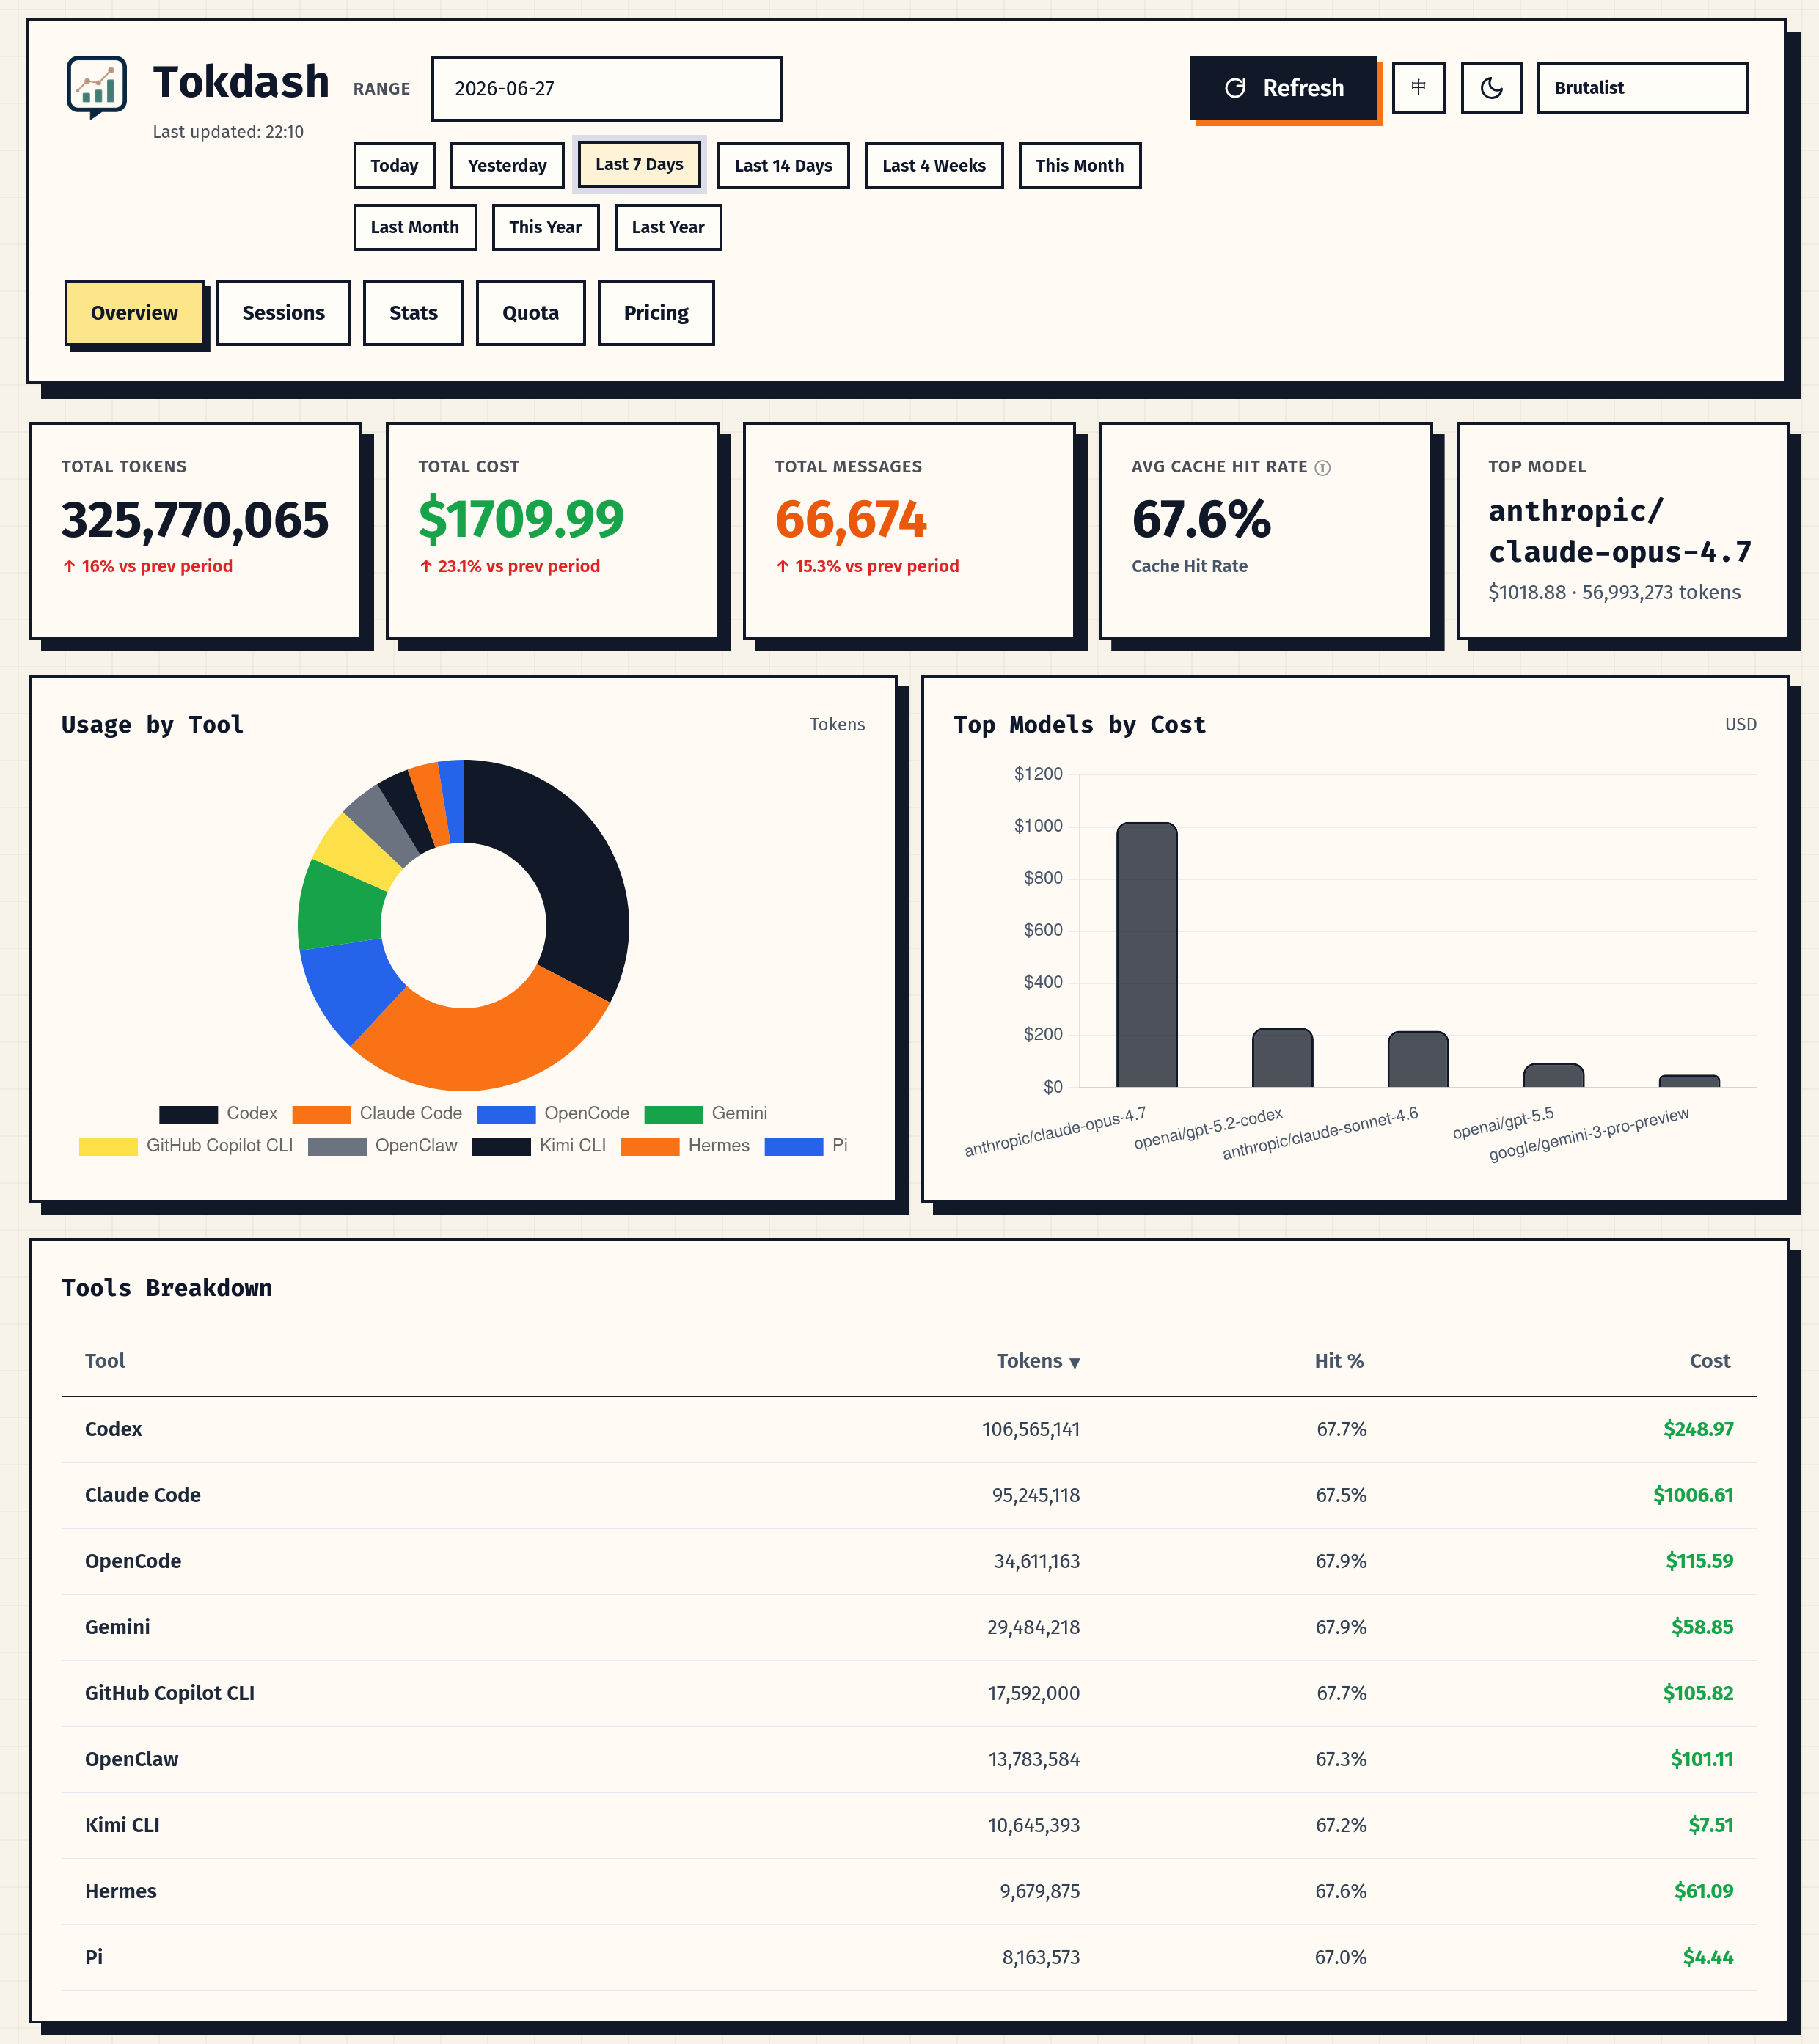
Four headline numbers across the top — Total Tokens, Total Cost (USD), Total Messages, Avg Cache Hit Rate — re-aggregate immediately when you change the date range (Today / Yesterday / Last 7 Days / This Month / custom via the calendar picker). Below them, three panels:
- Usage by Tool — a donut chart of token share across every supported agent. Codex, Claude Code, OpenCode, Gemini CLI, Kimi CLI, Pi, GitHub Copilot CLI, Amp, Hermes, OpenClaw all show up if they have sessions on disk.
- Top Models by Cost — the actual dollars, attributed per model, so a session that flipped from Sonnet 4.6 to Opus 4.8 mid-conversation shows up as two buckets instead of one blended line.
- Tools Breakdown — the per-tool table with the same totals in a sortable form.
The token numbers are read out of the raw log lines, not out of the model’s name in a config file, so when a tool records multiple model turns under one session ID each turn still gets its own bucket.
Sessions — find the session that ate your context
Totals are vague. The Sessions tab is the receipt: every session on disk, sorted, with the numbers that actually matter next to each other.
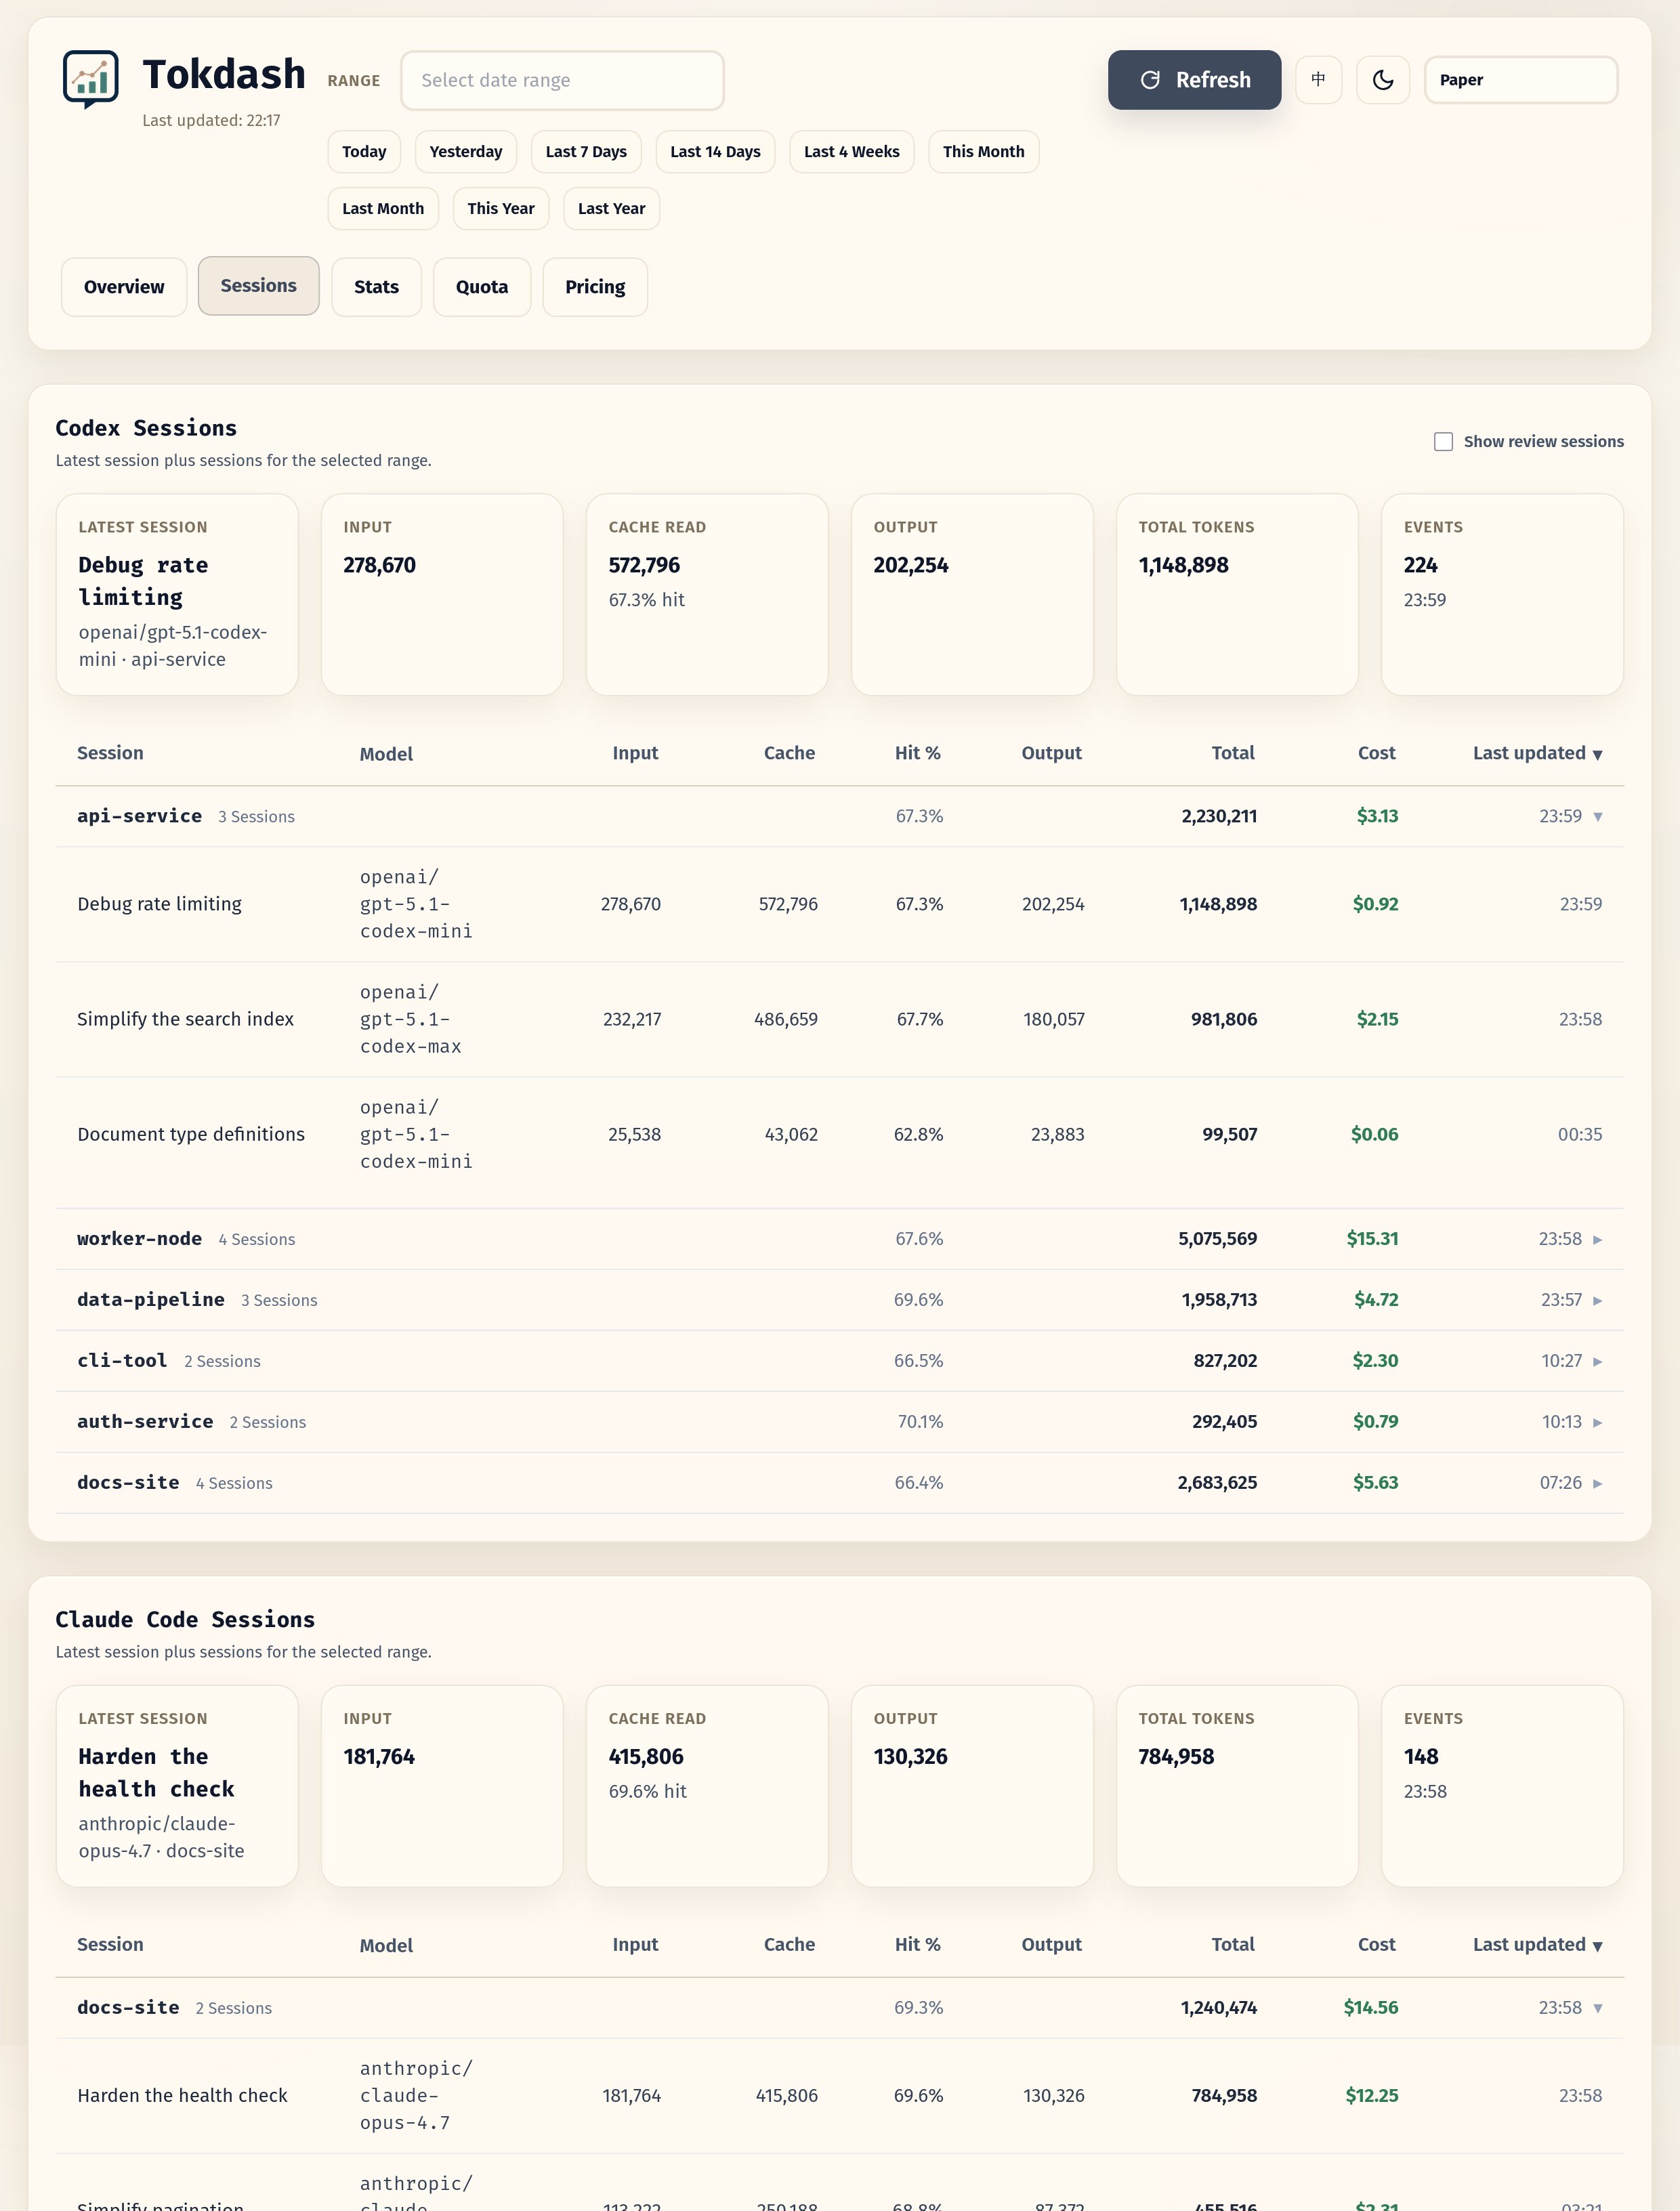
Each supported client gets its own sub-section (Codex Sessions, Claude Code Sessions, OpenCode Sessions, Pi Sessions, …), plus a Combined Sessions view that sorts everything together. Every row carries the same seven columns:
- Input — fresh tokens charged at full input price
- Cache — tokens served from the prompt cache
- Hit % — the ratio of cache-served to total input. This is the column that quietly decides your bill.
- Output — generated tokens
- Total — sum of the above
- Cost — USD, computed from the local pricing DB (or your override)
- Last Updated — when the session was last touched
Codex auto-permission review sessions are hidden by default with a one-click toggle to surface them. Pi’s session names come from session_info.name when present (otherwise from the first user message) instead of the project directory, which makes them readable in a long list.
Click any Codex / Claude Code / OpenCode / Pi session to drill in:
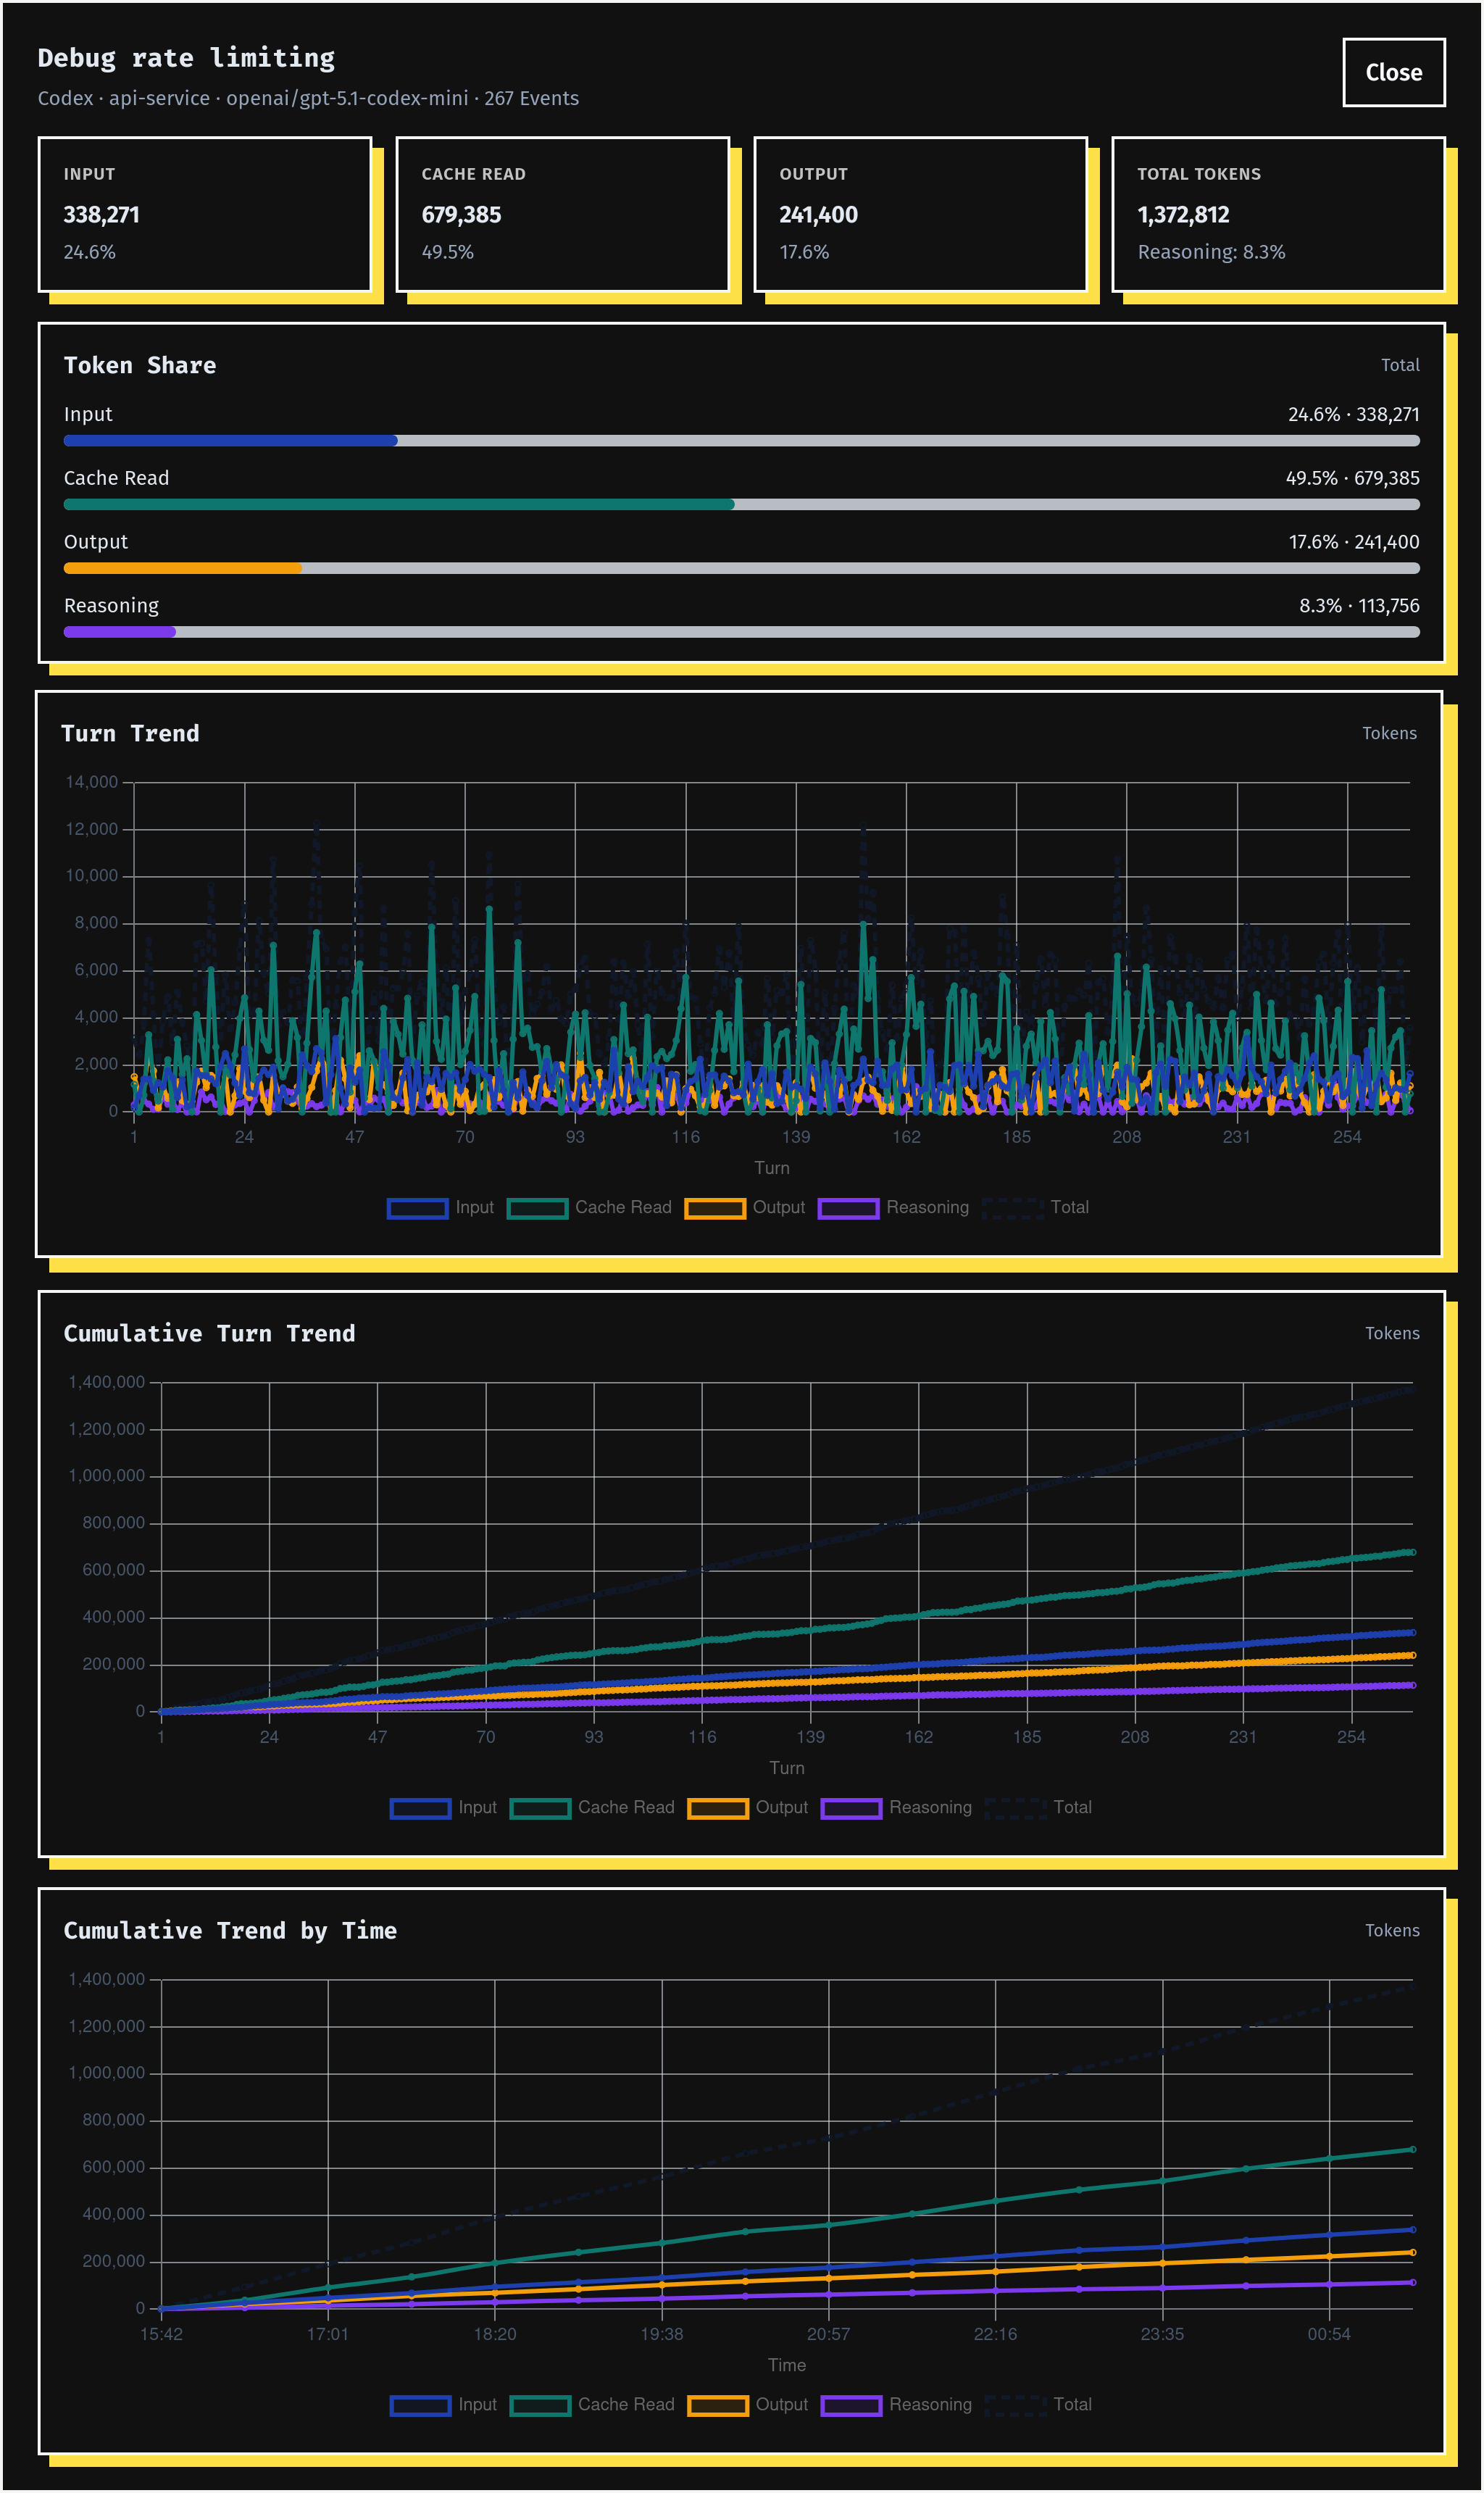
The turn-by-turn modal plots input, cache, output, and reasoning tokens on the same axes over the conversation timeline. This is the view that lets you see not just that a session was expensive but which turn burned the cache, which turn spilled into reasoning tokens, and when in the conversation the bill started climbing.
Stats — when are you actually spending?
The Overview answers how much. The Stats tab answers when. It’s a contribution calendar — Tokens / Cost / Messages — over Month, Year, or 3D, with streaks and peaks as first-class numbers.
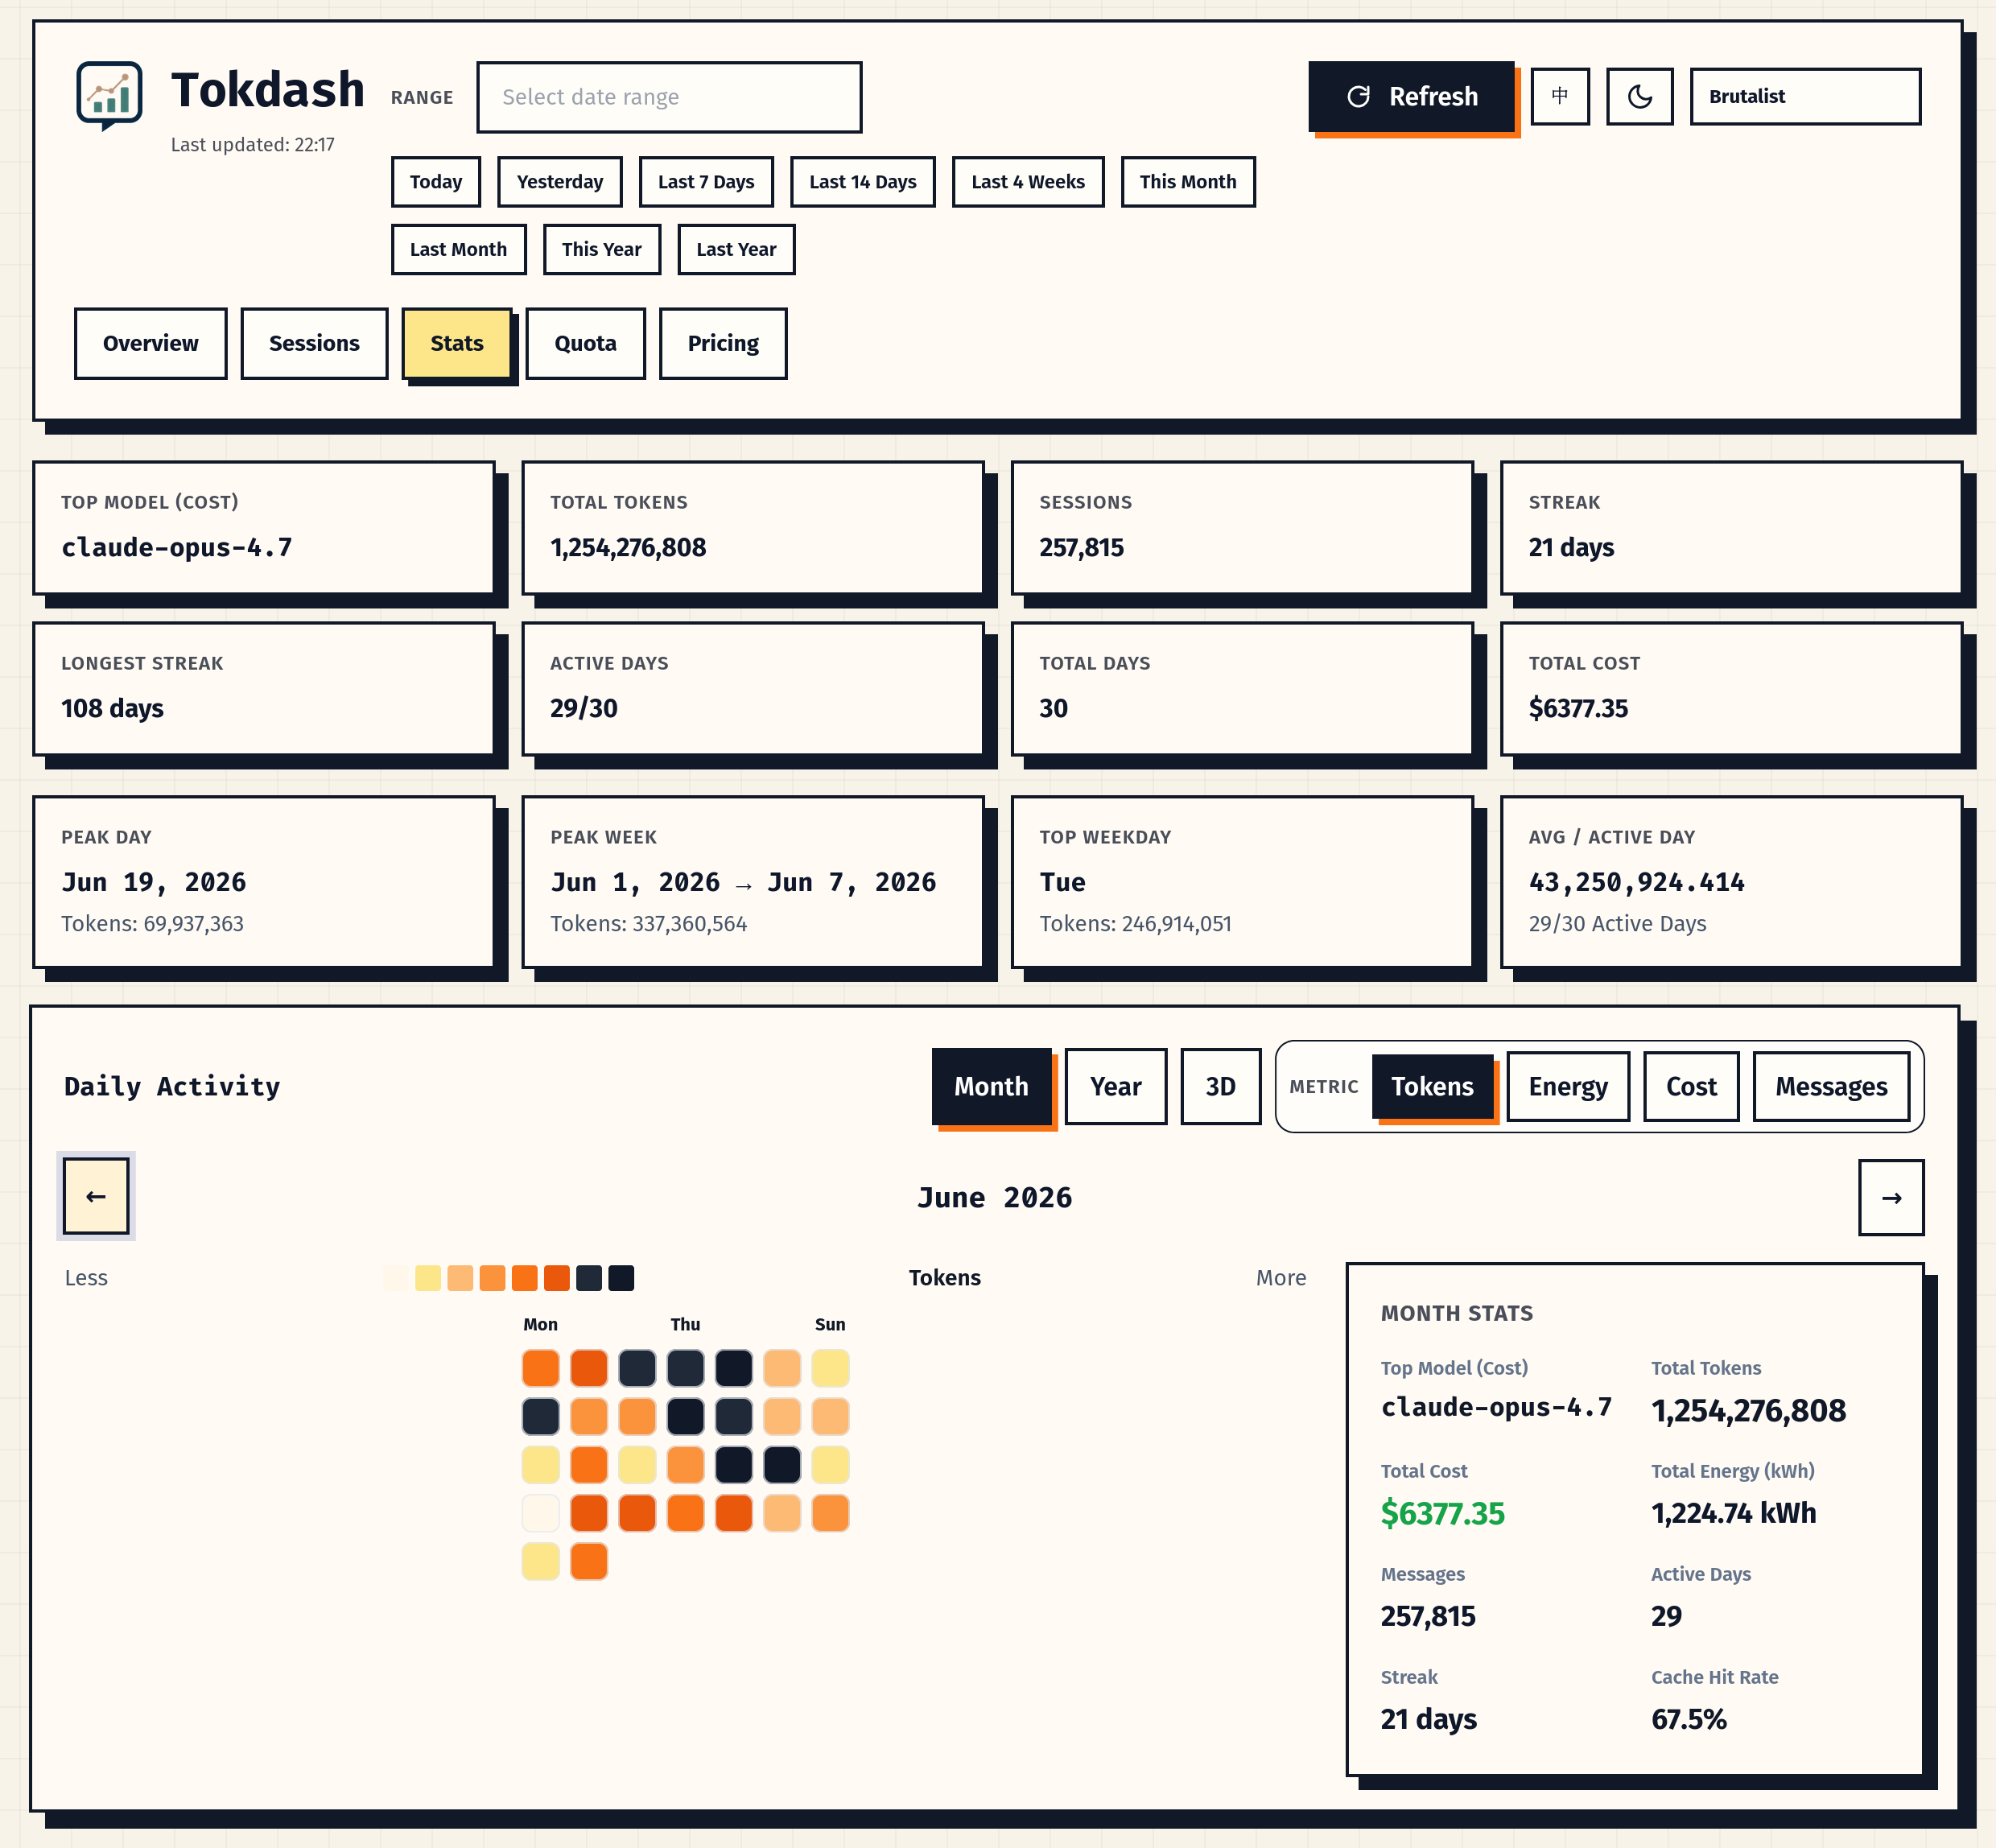
The monthly view is where you spot a runaway day. Click any cell and the day modal opens with the per-tool breakdown for that one date — useful for figuring out which session was the cause. Streaks tell you how many consecutive days you’ve coded with agents; peaks surface the single most expensive day in the window.
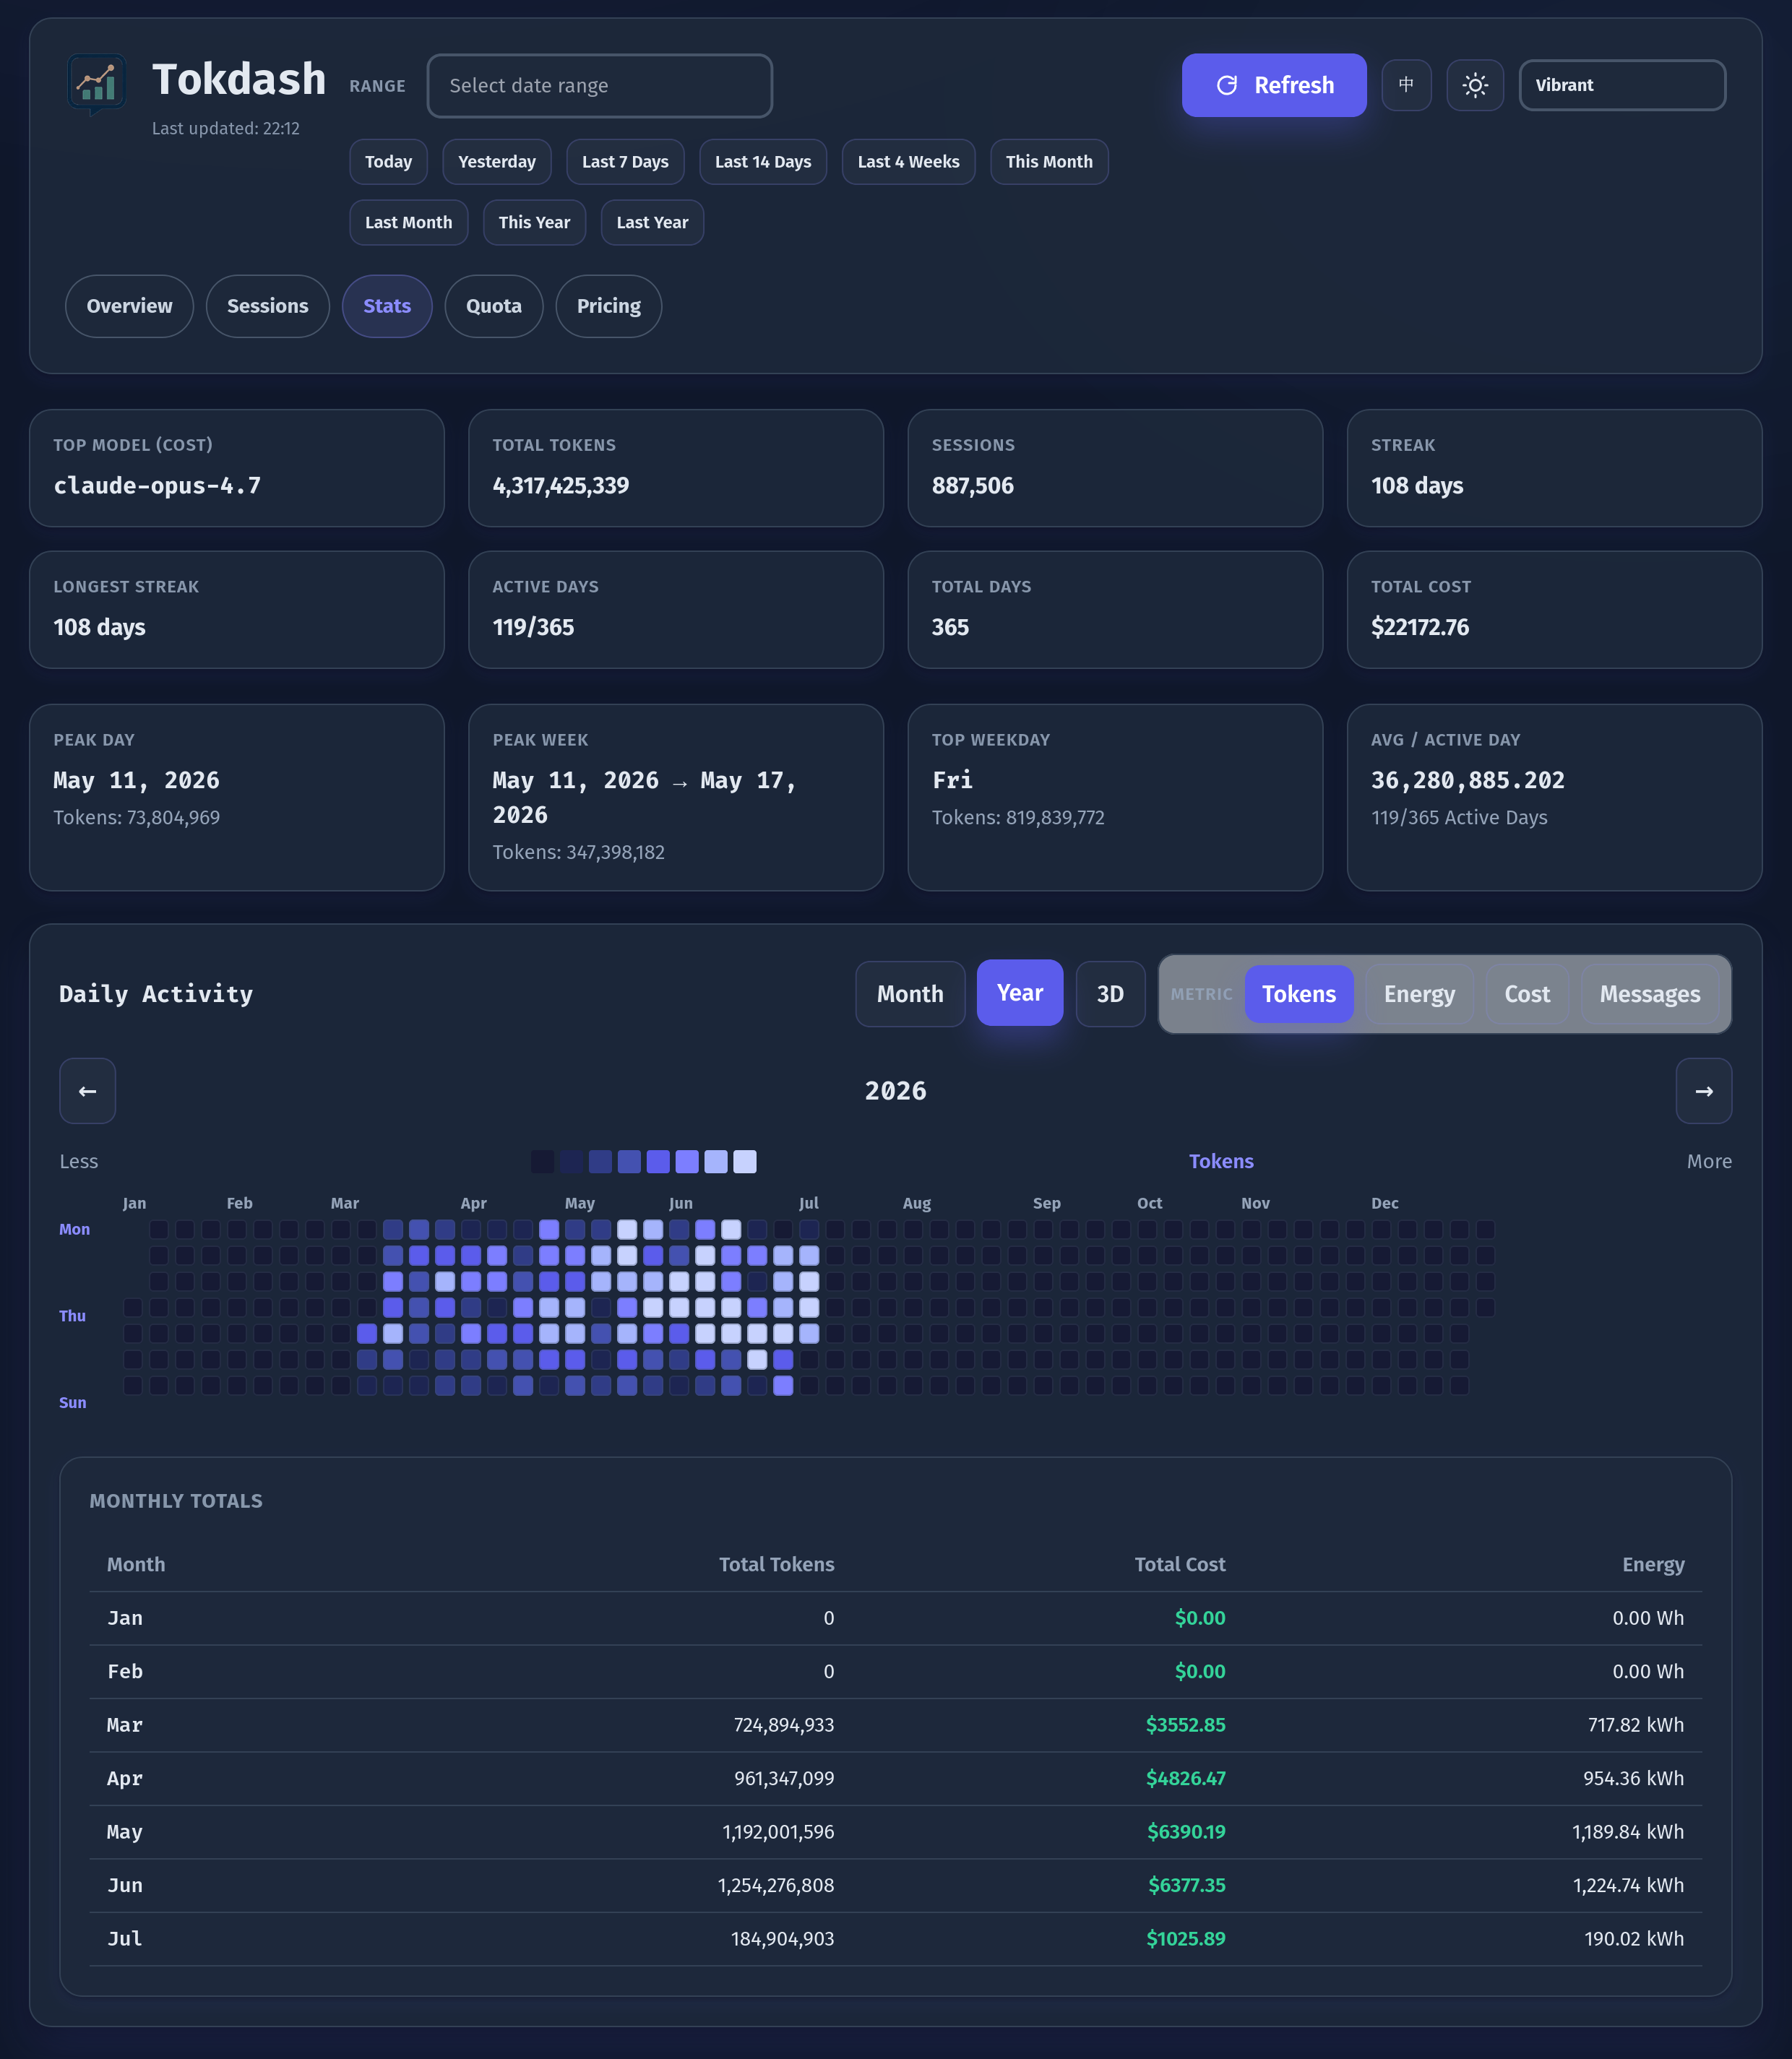
The year view, switched to Cost, is where the pattern-finding happens. The shape of the heatmap tells you about your workflow: which weeks you shipped, which weeks you refactored, where the slow weeks sit. It is the same graph GitHub gives you for commits, applied to dollars.
The 3D mode (each cube = one day, height and colour encode the same metric) and the Energy metric (Joules-per-token coefficients per model class, surfaced on the same axes as Tokens and Cost) are covered in the previous Tokdash post.
Quota — never get surprised by a limit again
If the rest of Tokdash is retrospective, the Quota tab is the forward-looking one. It shows remaining subscription windows across providers, with reset countdowns that update in place.
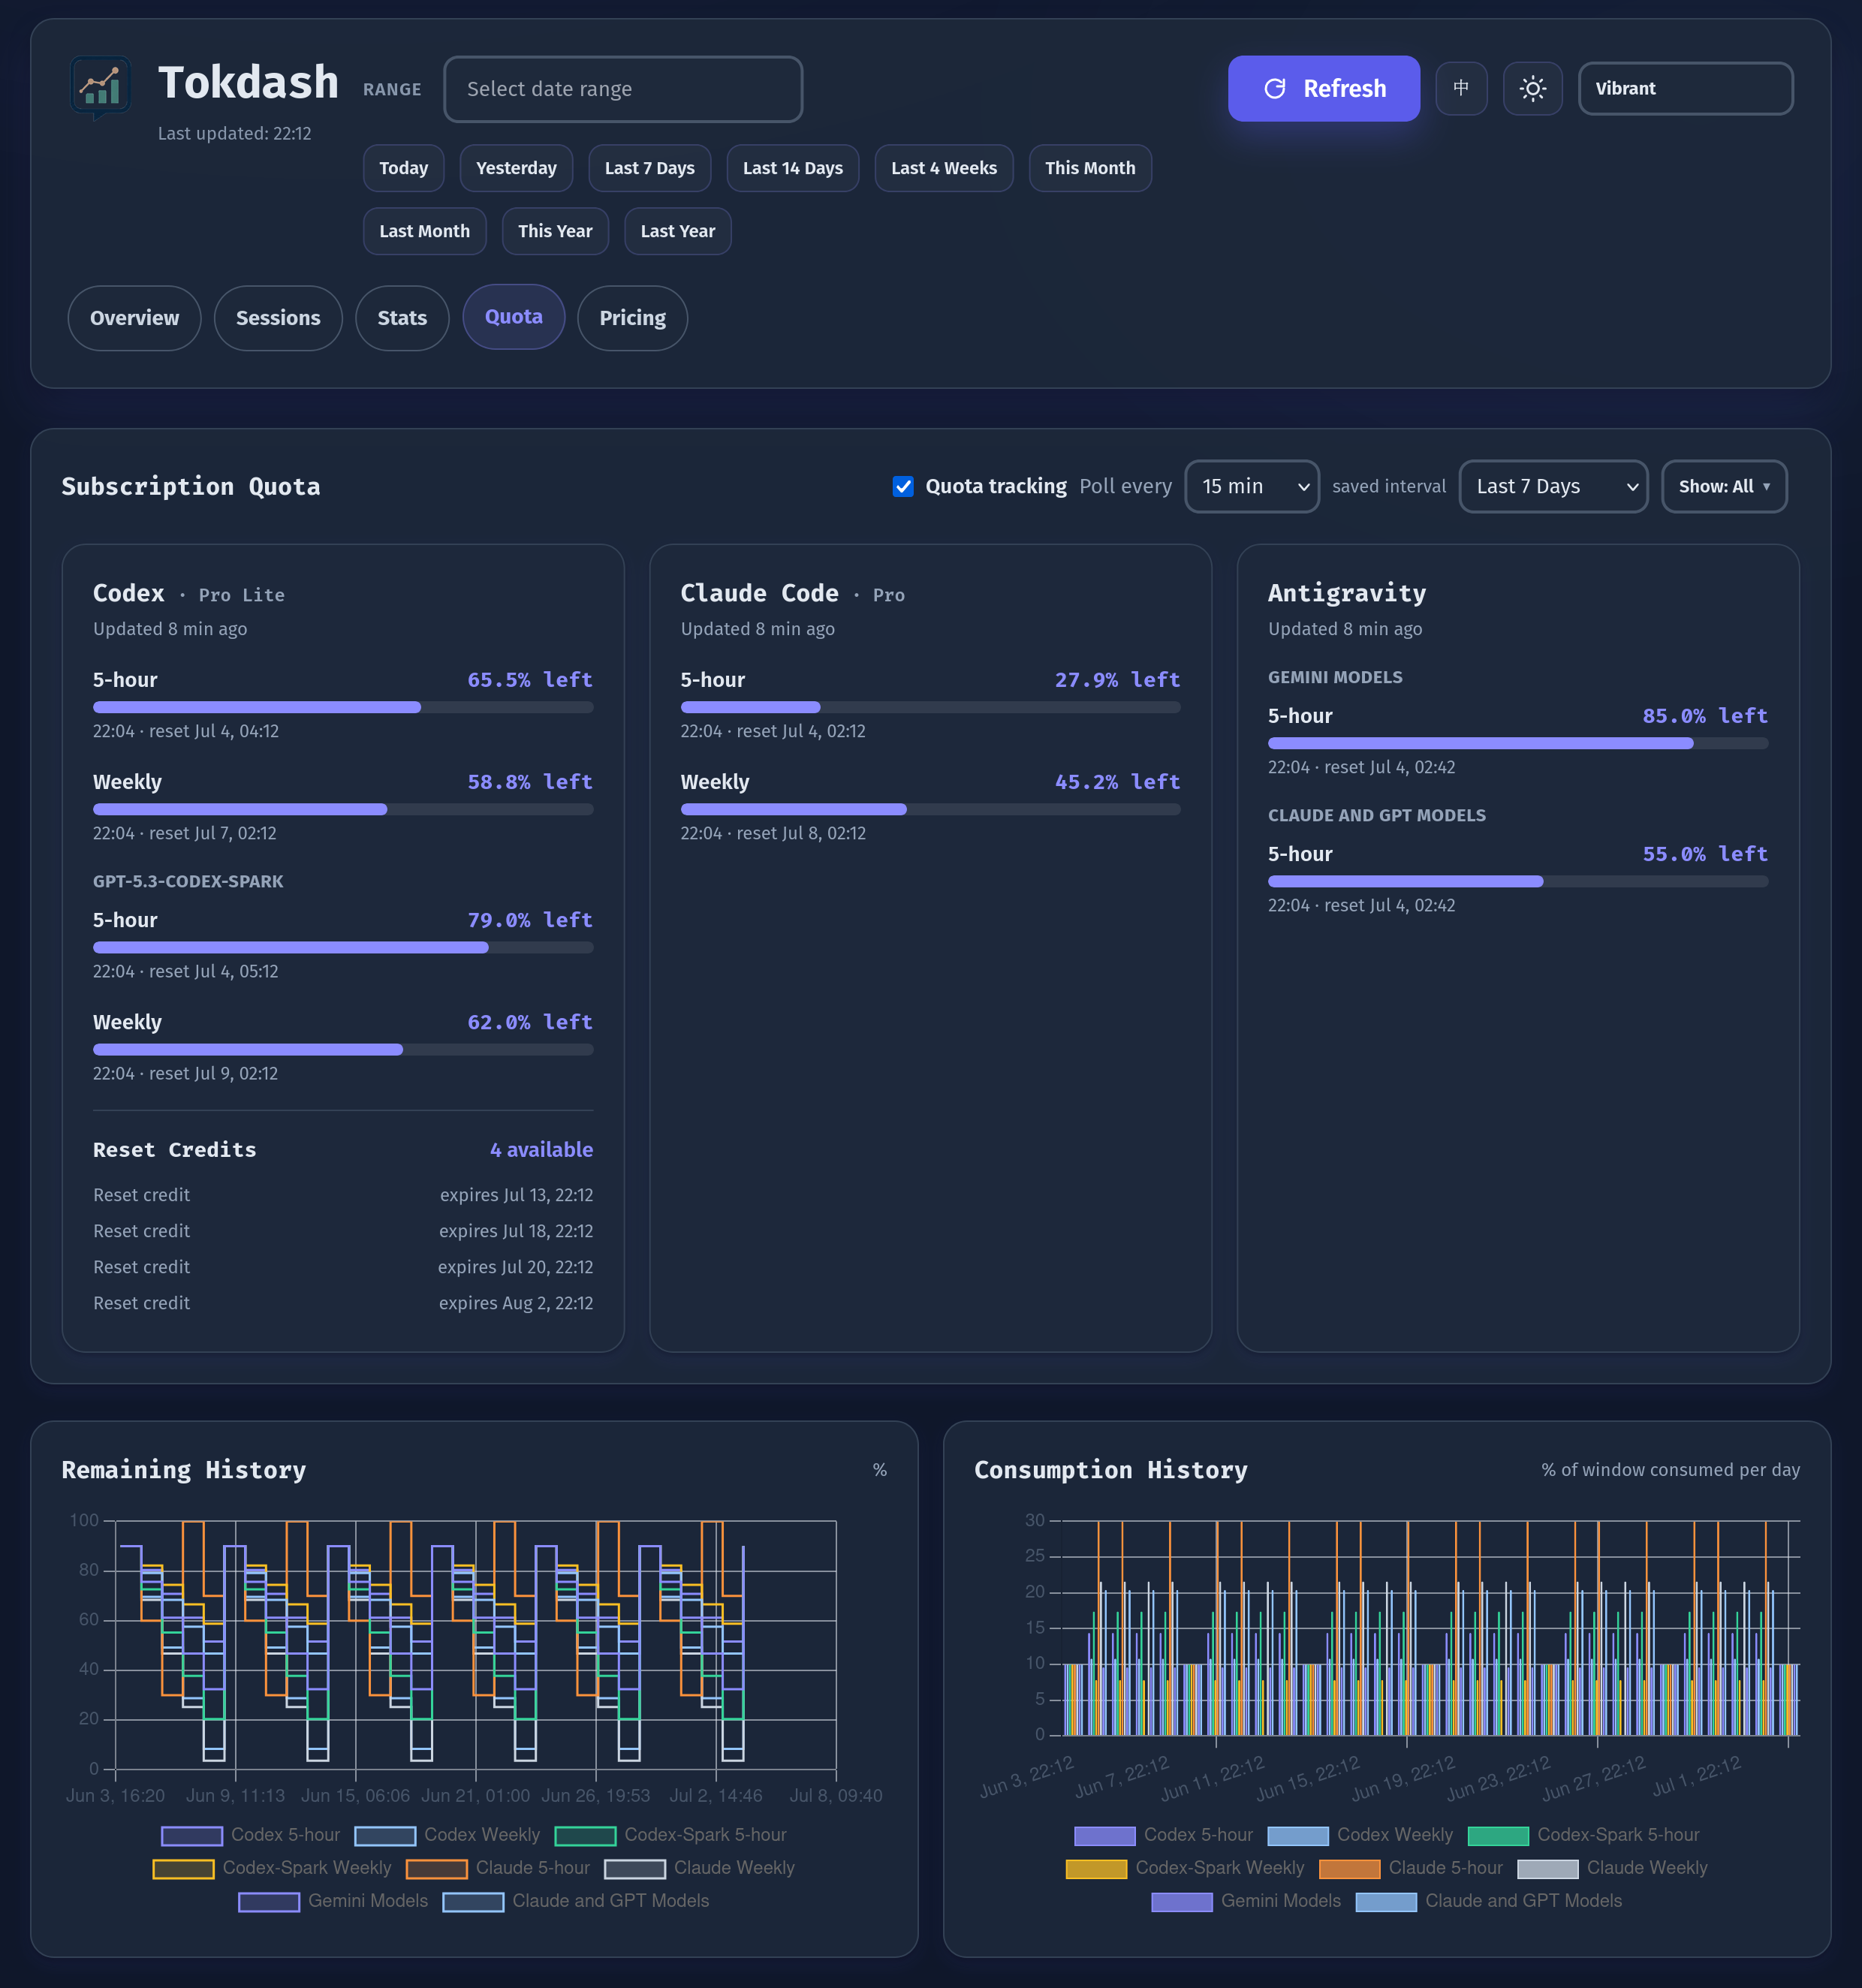
Each provider card carries the same shape: current window utilisation as a progress bar, the time until the next reset, and a per-window history chart that shows how fast you’ve been burning it. The history is what answers “am I using this window faster than last week?” without opening the billing dashboard.
Two things in this Quota update are worth calling out:
- Codex works out of the box — Claude and Antigravity are opt-in. Codex writes its own quota state into session files, so the Codex 5-hour and weekly windows appear in the Quota tab as soon as you’ve used Codex once. Claude Code and Antigravity quota need an opt-in because they require calling the provider’s quota endpoint with the credentials your CLI already has; the live polling toggle is per-provider, off by default, master-switchable from the tab or
tokdash quota consent. - Codex reset credits and metered features. Reset credits earned when a window rolls over used to be invisible until they expired; the Quota card now surfaces their expiry dates inline. Metered features (Codex-Spark) are tracked as a separate window so a session that’s fine on the 5-hour window doesn’t quietly eat into Spark credits you didn’t know you had.
The Codex card close-up is where this lands:
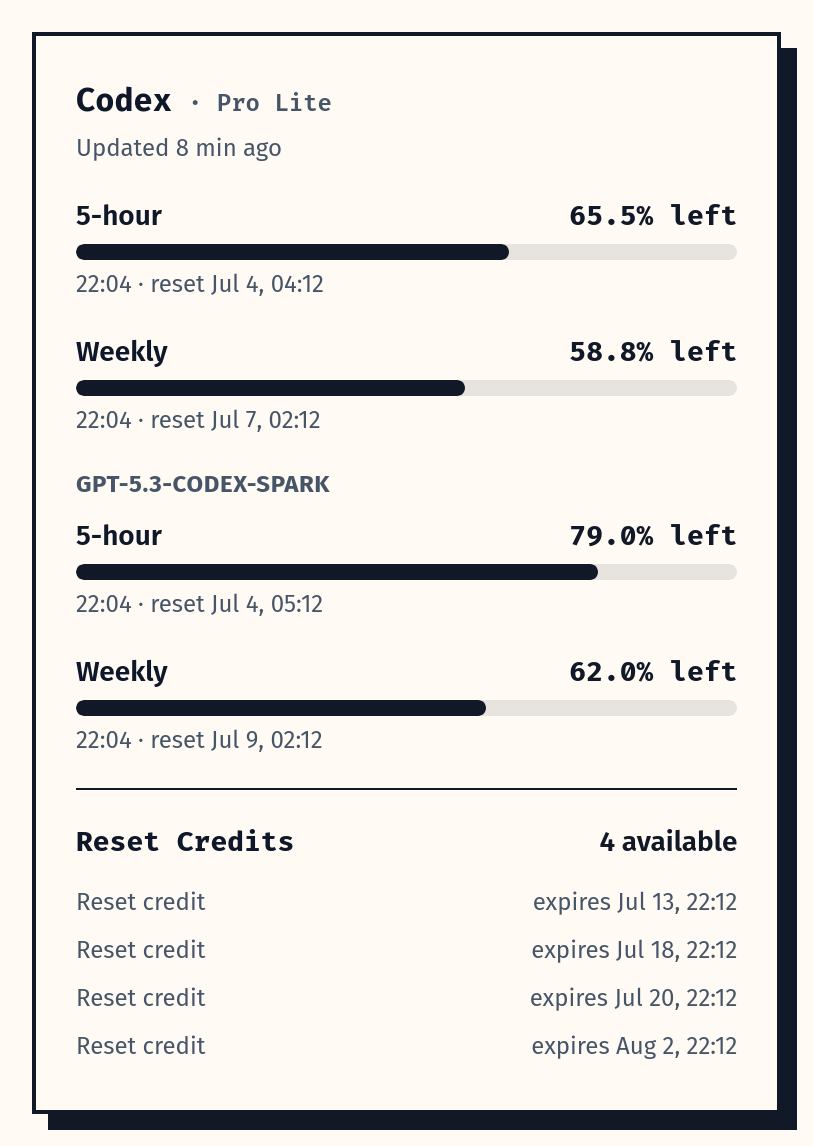
Three windows on one screen (5-hour, weekly, Spark), each with its own countdown and history trace, plus the reset-credit expiry strip across the bottom — the dates I actually lose money on when they slip by silently.
Statusline — see the cost while you can still do something about it
The dashboard tells you about the problem tomorrow. The statusline tells you about it while you can still do something about it. Tokdash exposes its data over a local HTTP API, and two ready-made templates ship in docs/examples/statusline/:
statusline-minimal.sh— one line:[Claude Sonnet 4.6] 📁 myproject | 📊 12.3M ($4.56) todaystatusline-full.sh— a four-row dashboard with today + week totals, the Claude Code context bar, a top-3 tools breakdown, and the rate-limit reset countdown.
Wiring either into Claude Code is a copy + a settings block:
1
2
3
mkdir -p ~/.claude/scripts
cp docs/examples/statusline/statusline-minimal.sh ~/.claude/scripts/statusline.sh
chmod +x ~/.claude/scripts/statusline.sh
1
2
3
4
5
6
7
8
// in ~/.claude/settings.json
{
  "statusLine": {
    "type": "command",
    "command": "bash ~/.claude/scripts/statusline.sh",
    "refreshInterval": 30
  }
}
refreshInterval is the detail that turns the line into a real feedback loop: re-runs every 30 seconds, so the numbers keep ticking while you sit and read. Fails silently if Tokdash isn’t running. Read-only, loopback only, no other endpoint required. Full write-up — including the four-row template and the API schema — is in the previous Tokdash post.
A real lifecycle, not a static script
Pre-1.0, keeping Tokdash alive at boot meant writing your own systemd unit, a launchd plist, or a tmux session. v1.0 replaced that with a Python-native lifecycle:
1
2
3
4
5
pipx install tokdash    # isolated env, a stable `tokdash` on PATH
tokdash setup           # configures + starts a loopback-only background service
tokdash doctor          # runtime, service, port, data dir, update-check status
tokdash update          # upgrade the managed runtime, restart the service
tokdash uninstall       # reverse exactly what setup created (--purge to wipe history)
setup asks whether you want a systemd user service on Linux/WSL2 or a launchd LaunchAgent on macOS, writes a unit file with a /health fingerprint the platform can verify, points the service at the interpreter that ran setup (or a managed venv if you ask for one with --runtime venv), and prints the URL when the readiness probe passes. No sudo for the local service, no writes to /etc, no shell-init-file hunting.
update only drives runtimes it can safely own; if you installed via conda base or pip install --user, it prints the exact manual command instead of mutating that environment. uninstall is manifest-driven — it reverses only what setup created, records a failure if a stop command fails (no false-success), and only removes the manifest when the service is actually gone. TOKDASH_UPDATE_CHECK=1 makes doctor and POST /api/update-check report whether a newer version is on PyPI using PEP 440 comparison. It only reports. It never upgrades in the background.
For scripts and bundlers, the supported contract is tokdash setup --auto --json. To preview without applying: tokdash setup --dry-run.
What it deliberately does not do
Worth saying out loud:
- It does not talk to your providers for usage data. Token counts come from local session logs the clients already write. Costs come from a local JSON file (with a user override). Nothing is uploaded.
- It does not control your agents. There is no “stop spending” button, and there shouldn’t be — that’s the agent’s job, and it should be your decision, not the dashboard’s.
- It does not auto-upgrade. Even with the v1.0 update check enabled,
doctoronly reports. Upgrades are an explicittokdash update. - It does not fix history retention. Claude Code and Gemini CLI delete sessions older than ~30 days by default, which means Tokdash’s earlier months can quietly shrink. Both are a one-line config fix per client, and the README documents both.
Try it
The fastest path is the live demo against synthetic data:
- Live demo: tokdash.github.io/demo
- Project home: tokdash.github.io
- Repo: github.com/JingbiaoMei/Tokdash
If you want it on your own sessions, the install is two lines (above), and the lifecycle is setup / doctor / update / uninstall.
If a metric you wish Tokdash surfaced is missing, open an issue. Most of the dashboard is one src/tokdash/static/index.html and one set of FastAPI routes in src/tokdash/api.py, and the bar for a PR is low. The next feature I want is per-prompt cost breakdowns inside a single session — if someone else writes it first I will buy them a coffee.
Jingbiao Mei is a final-year PhD student at the University of Cambridge’s Machine Intelligence Lab, working on multimodal retrieval, agent systems, and the kind of tool-usage problems that only show up after the third coding agent is on the machine at the same time. He is the creator of Tokdash, ATM-Bench, FLMR, PreFLMR, and ExPO-HM.

Comments