Contents
- The v1.0 install story: setup, doctor, update, uninstall
- Tailscale Serve, wired into setup
- The Overview tab
- The Sessions tab: drill-down by agent
- The Stats tab: a 3D contribution calendar
- Themes: ten, including the ones I didn’t expect to like
- The statusline integration: my favourite hidden feature
- The Pricing tab (now with user-override persistence)
- Why it stays fast: a local SQLite usage index
- What it does not do
- Try it
- Comments
For the last six months every working session on my laptop has been a negotiation with at least one AI coding agent — Claude Code for refactors, Codex for quick prototypes, OpenCode when I want an open model, occasionally Gemini CLI, Kimi, or Pi for second opinions. They are excellent at writing code and absolutely silent about what they cost.
That silence is the problem Tokdash fixes. It is a small, local FastAPI server that reads each client’s session logs, parses out the Input / Output / Cache token counts, joins them against a local pricing database, and exposes the result as a single dashboard. No telemetry, no cloud account, no upload — just the truth, on localhost, in a tab I can pin.
I have been using it daily since v0.4. With v1.0.4 out this week, the project is no longer just a dashboard — it is a small platform with a proper install / verify / update / remove lifecycle. That story is what I want to write down, because the README’s old “pip install + tokdash serve + hand-rolled systemd unit” path is gone, and the replacement is much better.
Try it without installing: tokdash.github.io/demo — the unmodified frontend against an in-browser synthetic-data shim. All tabs, all themes, all date ranges.
The v1.0 install story: setup, doctor, update, uninstall
Pre-1.0, getting Tokdash to start at boot meant writing your own systemd user unit, a launchd plist, or a tmux session. The README shipped templates; the templates worked; but every user who wanted “Tokdash running on this machine, always” had to write some YAML.
v1.0 replaced that with a Python-native lifecycle. The package now ships four commands that do the install, the diagnosis, the upgrade, and the removal — and every one of them is reversible.
1
2
pipx install tokdash        # isolated env, a stable `tokdash` on PATH
tokdash setup               # configures + starts a loopback-only background service
That is the whole first-run. setup asks whether you want a systemd user service on Linux/WSL2 or a launchd LaunchAgent on macOS, writes a unit file with a /health fingerprint the platform can verify, points the service at the interpreter that ran setup (or a managed venv if you ask for one with --runtime venv), and prints the URL when the readiness probe passes. It does not need sudo for the local service. It does not write to /etc. It does not need you to remember which shell init file you pasted the env vars into.
The other three commands close the loop:
1
2
3
tokdash doctor              # runtime, service, port, data dir, update-check status
tokdash update              # upgrade the managed runtime, restart the service
tokdash uninstall           # reverse exactly what setup created (keeps history by default)
A few properties that matter in practice:
setupis non-mutating by default. If it runs without a TTY and without--auto/--yes, it prints the plan and exits non-zero. The whole command is “fail closed if I wasn’t explicitly told to do something.”setupwon’t silently replace an existing service. If you already have a hand-writtentokdash.service,setuprefuses by default — even if the port already answers Tokdash. Keep managing that service yourself, or pass--forceaftersetup --dry-run.--forcealso handles pre-1.0 manual services that occupied the port but didn’t expose the new/healthfingerprint: it rewrites the unit, restarts it, and only reports success when the port actually serves Tokdash.doctor --jsonis the contract for bundlers and agents. Every command supports--auto/--jsonand--dry-run. The non-interactive contract is the supported path; the interactive wizard is the sugar.updateonly drives runtimes it can safely own. If you installed via conda base orpip install --user,updateprints the exact manual command instead of mutating that environment. To hand ownership to Tokdash:tokdash setup --runtime venv --force(the migration recipe documented in v1.0.3; the flags themselves shipped in v1.0) rewrites the service to run~/.tokdash/runtime/python-venv/bin/python -m tokdashand recordsinstall_method: managed-venvso future updates just work.uninstallis manifest-driven. Everything setup created is owned and reversible. The unit file, the service, the data dir’sinstall.jsonownership markers —uninstallreverses each step, records a failure if a stop command fails (no false-success), and only removes the manifest when the service is actually gone. Pass--purgeto also wipe the usage history.- There is also an optional, default-off update check.
TOKDASH_UPDATE_CHECK=1(orPOST /api/update-check/consent) makestokdash doctorandPOST /api/update-checkreport whether a newer version is on PyPI using PEP 440 comparison. It only reports. It never upgrades in the background.
This is the part of v1.0 I am most proud of, not because the dashboard changed — it didn’t, much — but because the project stopped asking users to write shell scripts to keep a Python tool alive.
Tailscale Serve, wired into setup
For the first time this week I can run Tokdash on my desk machine and open it from my phone on the same tailnet with zero SSH incantation. The mechanism is tailscale serve, and v1.0 wires it into setup properly.
When Tailscale is installed and you choose the Tailscale Serve option in the interactive setup, the wizard now:
- Detects the “serve config denied” case (which happens when Tailscale’s operator permission is not set on your user) and offers the one-time
sudo tailscale set --operator=$USERgrant, then retries. - Issues a path-scoped Serve rule at
/tokdash, so the root of your tailnet host stays free for whatever else you serve there. - Captures the actual
https://…ts.net/tokdashURL fromtailscale serve statusand prints it, instead of asking you to assemble it yourself.
It also documents, honestly, the one thing Tailscale Serve can’t do: proxied requests fail Tokdash’s loopback write-protection gate, so the dashboard is read-only over the tailnet. For trusted remote writes, the README points you at ssh -L 55423:127.0.0.1:55423. That constraint is the right one — the local API is not an internet-facing authenticated service — but it’s the kind of thing v1.0 stops hiding.
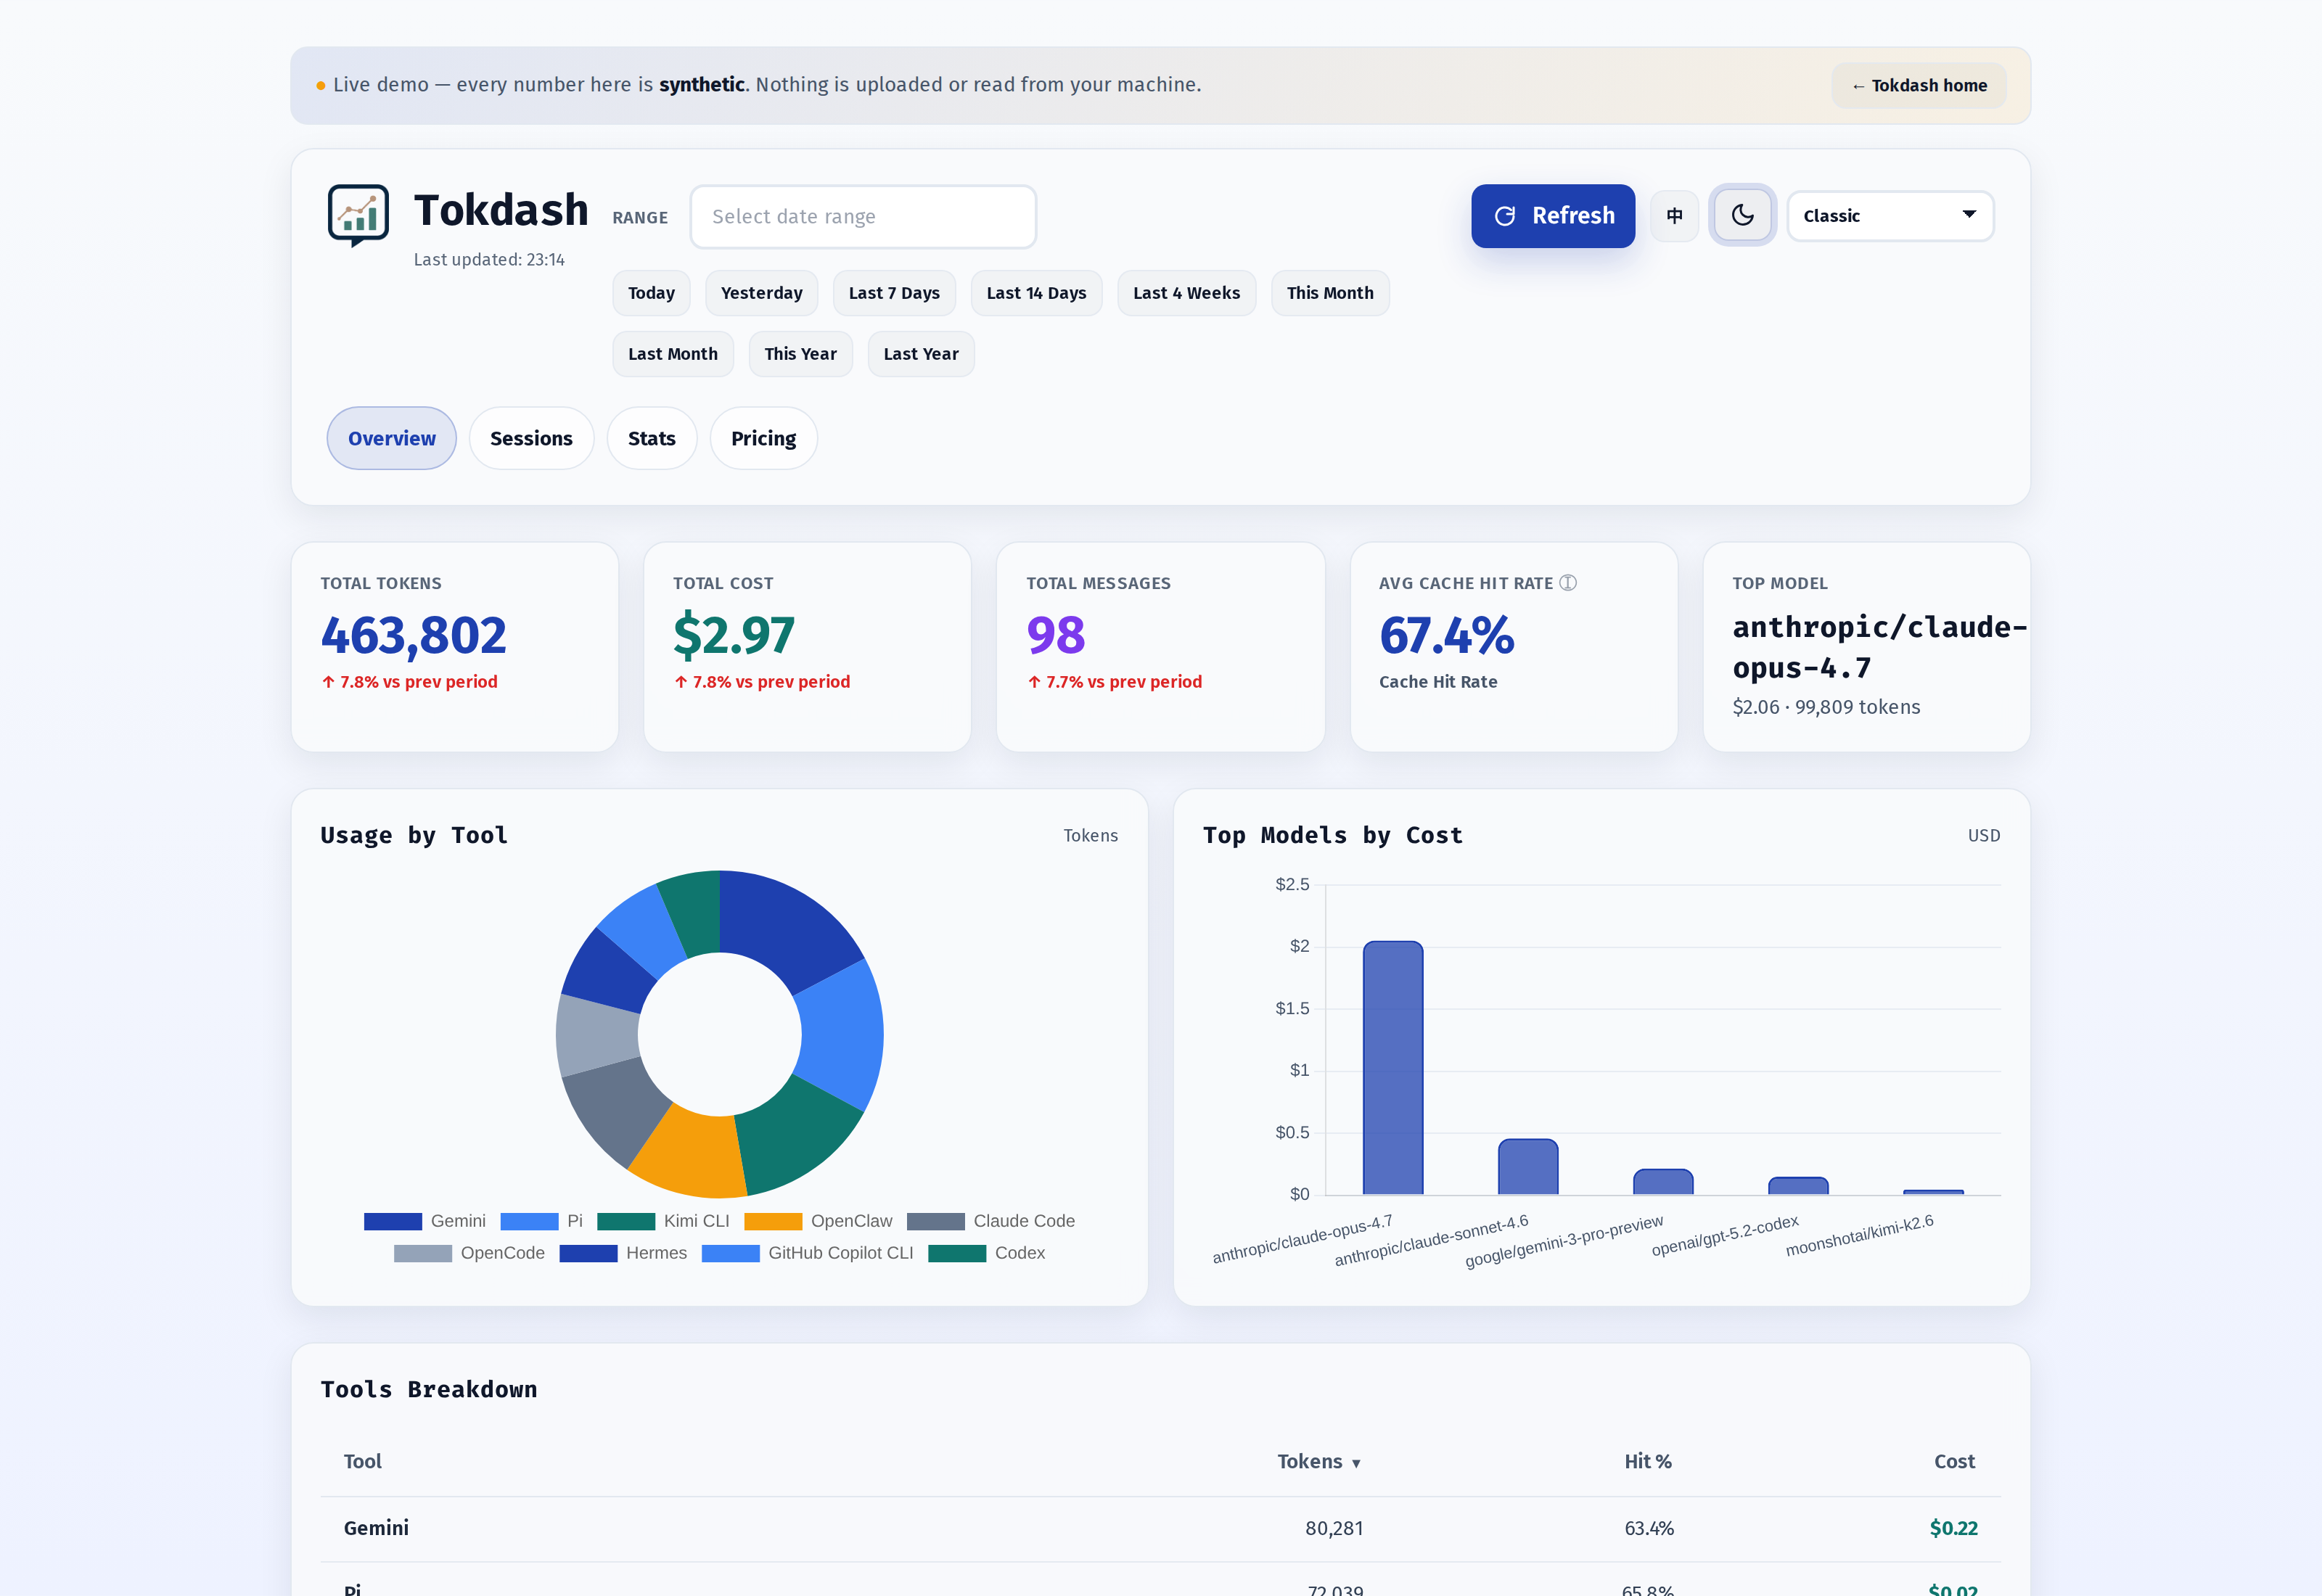
The Overview tab
This is what you see when you land on the dashboard. It is built to answer three questions fast: how much did I spend today, which model is the culprit, and which tool is the heaviest.
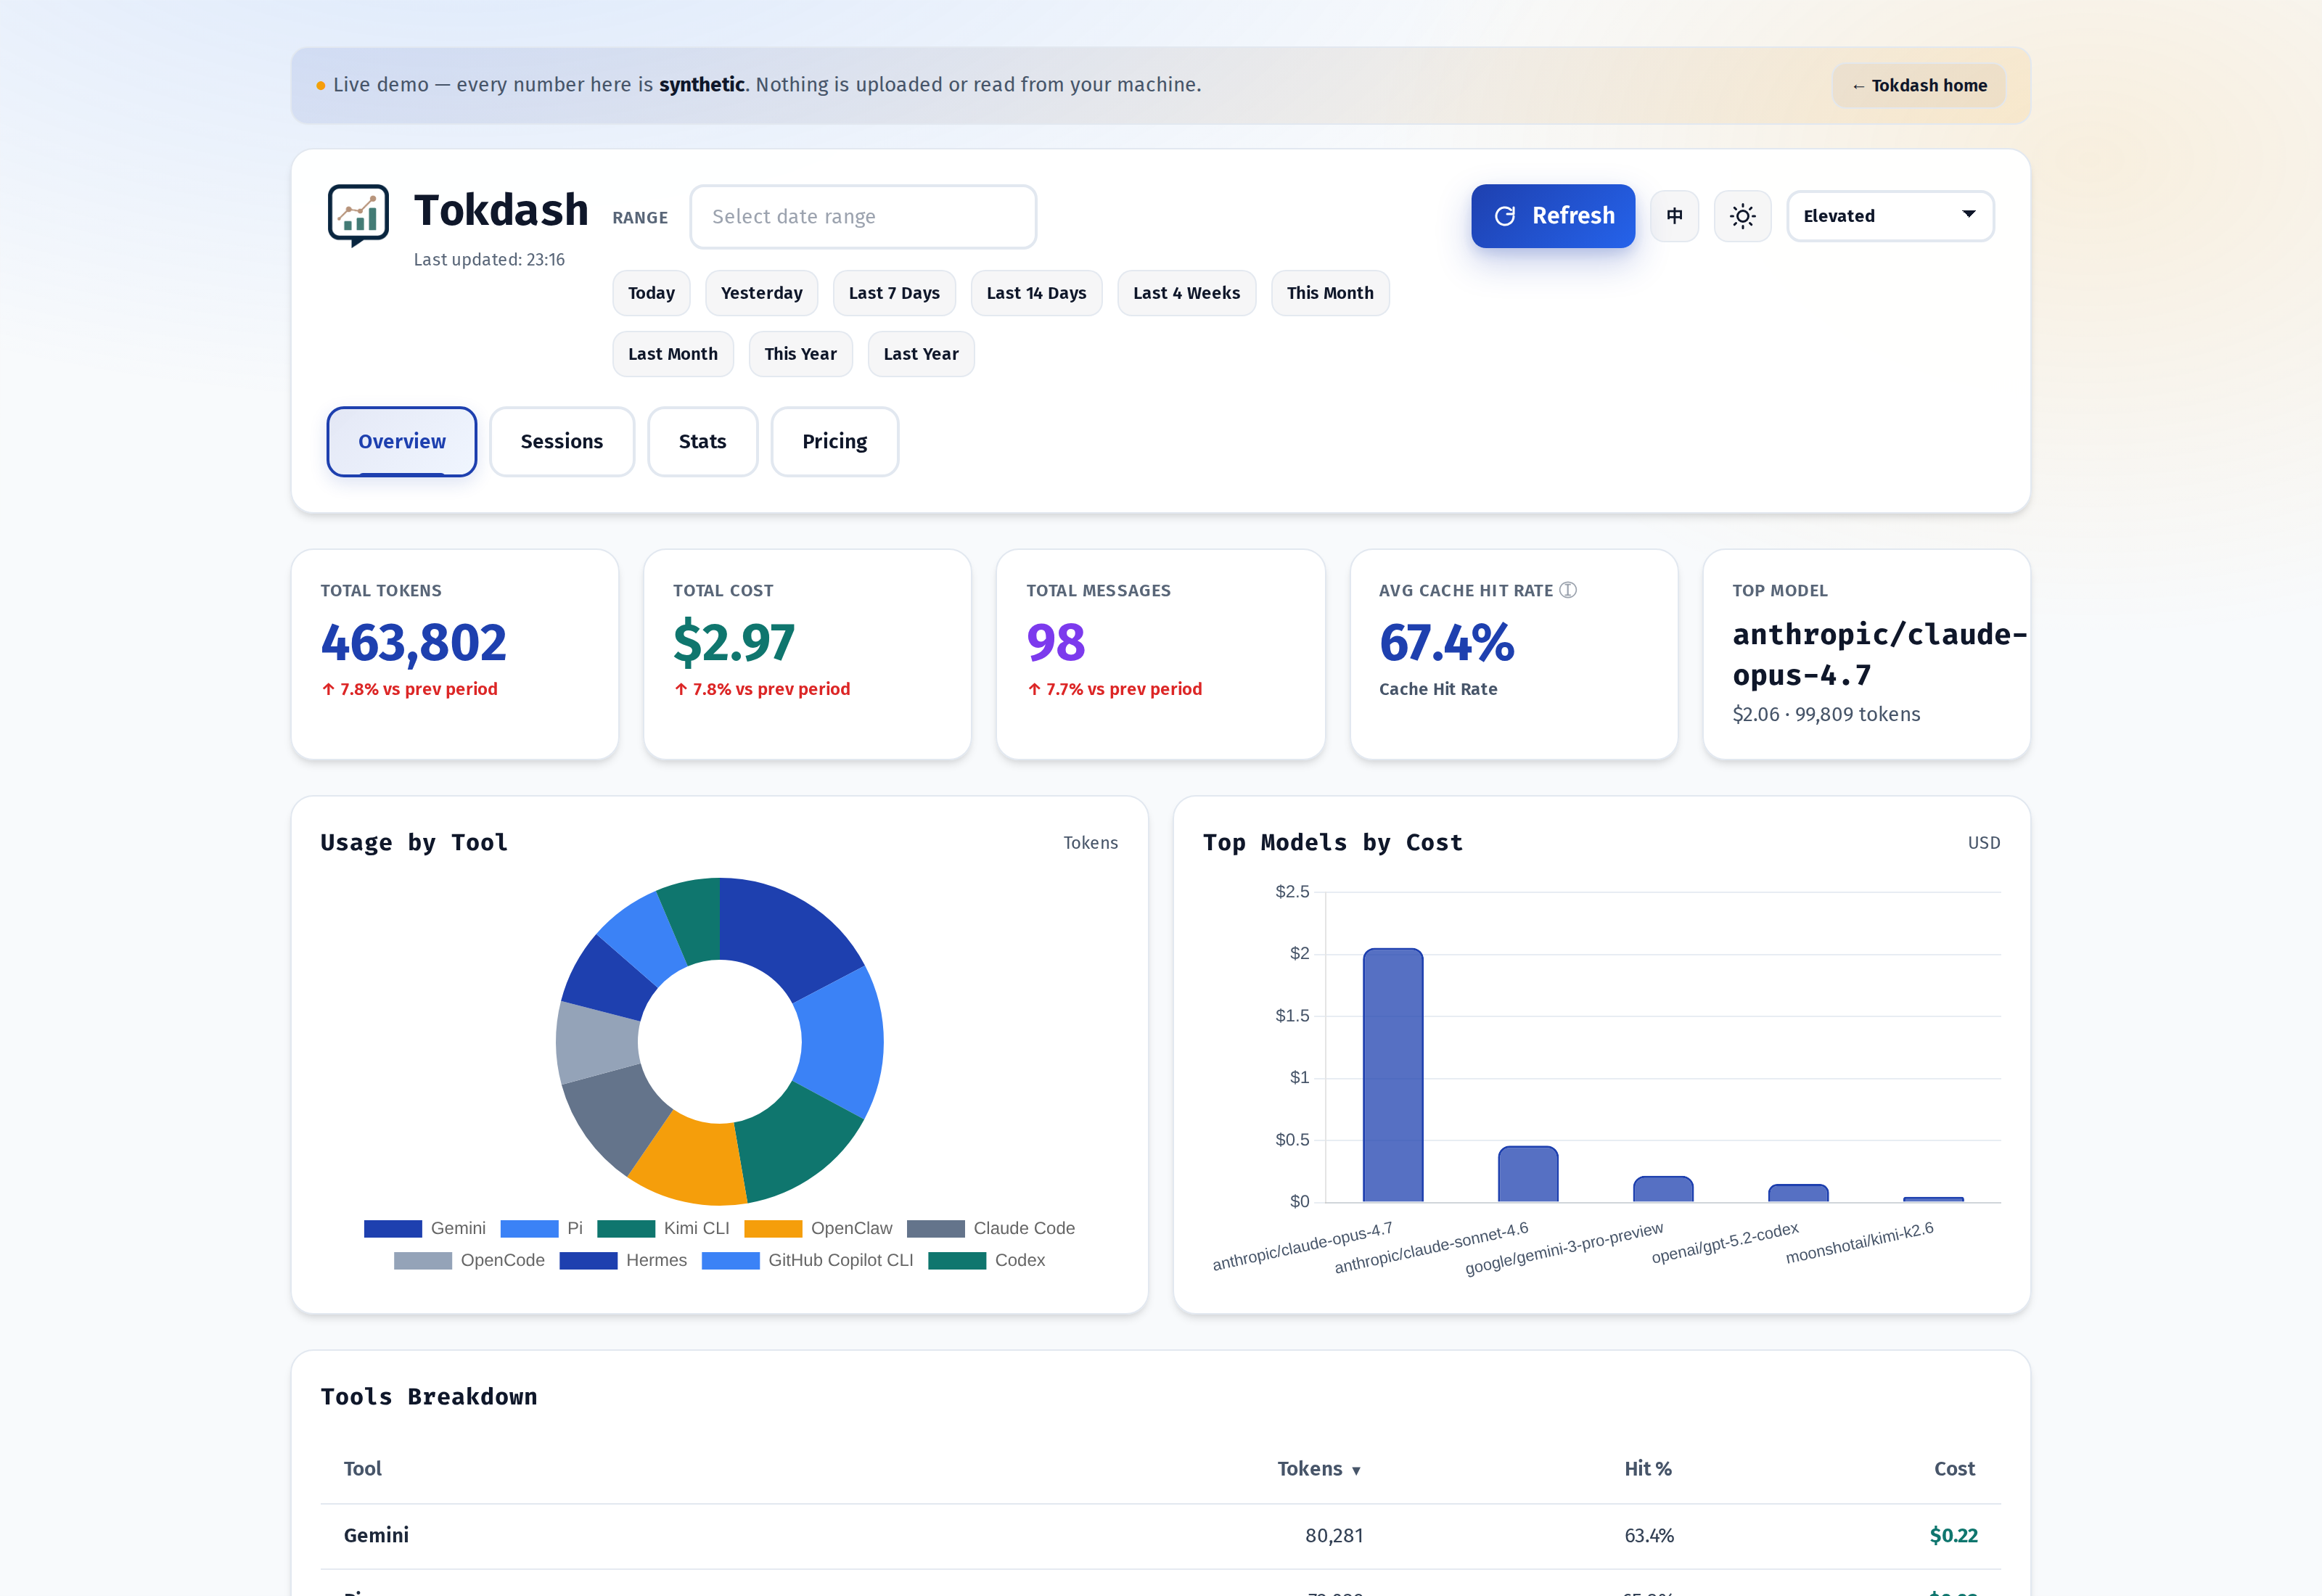
The top row is the headline: Total Tokens, Total Cost, Total Messages, Avg Cache Hit Rate, Top Model. Below that is a Usage by Tool donut chart (Claude Code, Codex, OpenCode, Gemini, Kimi CLI, Pi, GitHub Copilot CLI, Amp, Hermes, OpenClaw) and a Top Models by Cost panel that does what its name promises. Pick a date range from the top-left — Today, Yesterday, Last 7 Days, This Month, anything via the Flatpickr calendar — and every panel re-aggregates.
The numbers are exact, not estimated. The parsers in src/tokdash/sources/ read the raw session files each client writes to disk (Codex’s JSONL, Claude Code’s ~/.claude/projects, OpenCode’s SQLite, …) and pull token counts out of the actual log lines, not out of the model’s name in a config file. That distinction matters when a single session runs Opus 4.8 and Sonnet 4.6 back-to-back — each gets its own bucket, and the bill reflects it.
The Sessions tab: drill-down by agent
The Overview gives you totals. The Sessions tab gives you receipts. Each client gets its own sub-section — Codex Sessions, Claude Code Sessions, OpenCode Sessions — plus a Combined Sessions view that sorts everything together. Pi joined the drill-down list in v0.6.2.
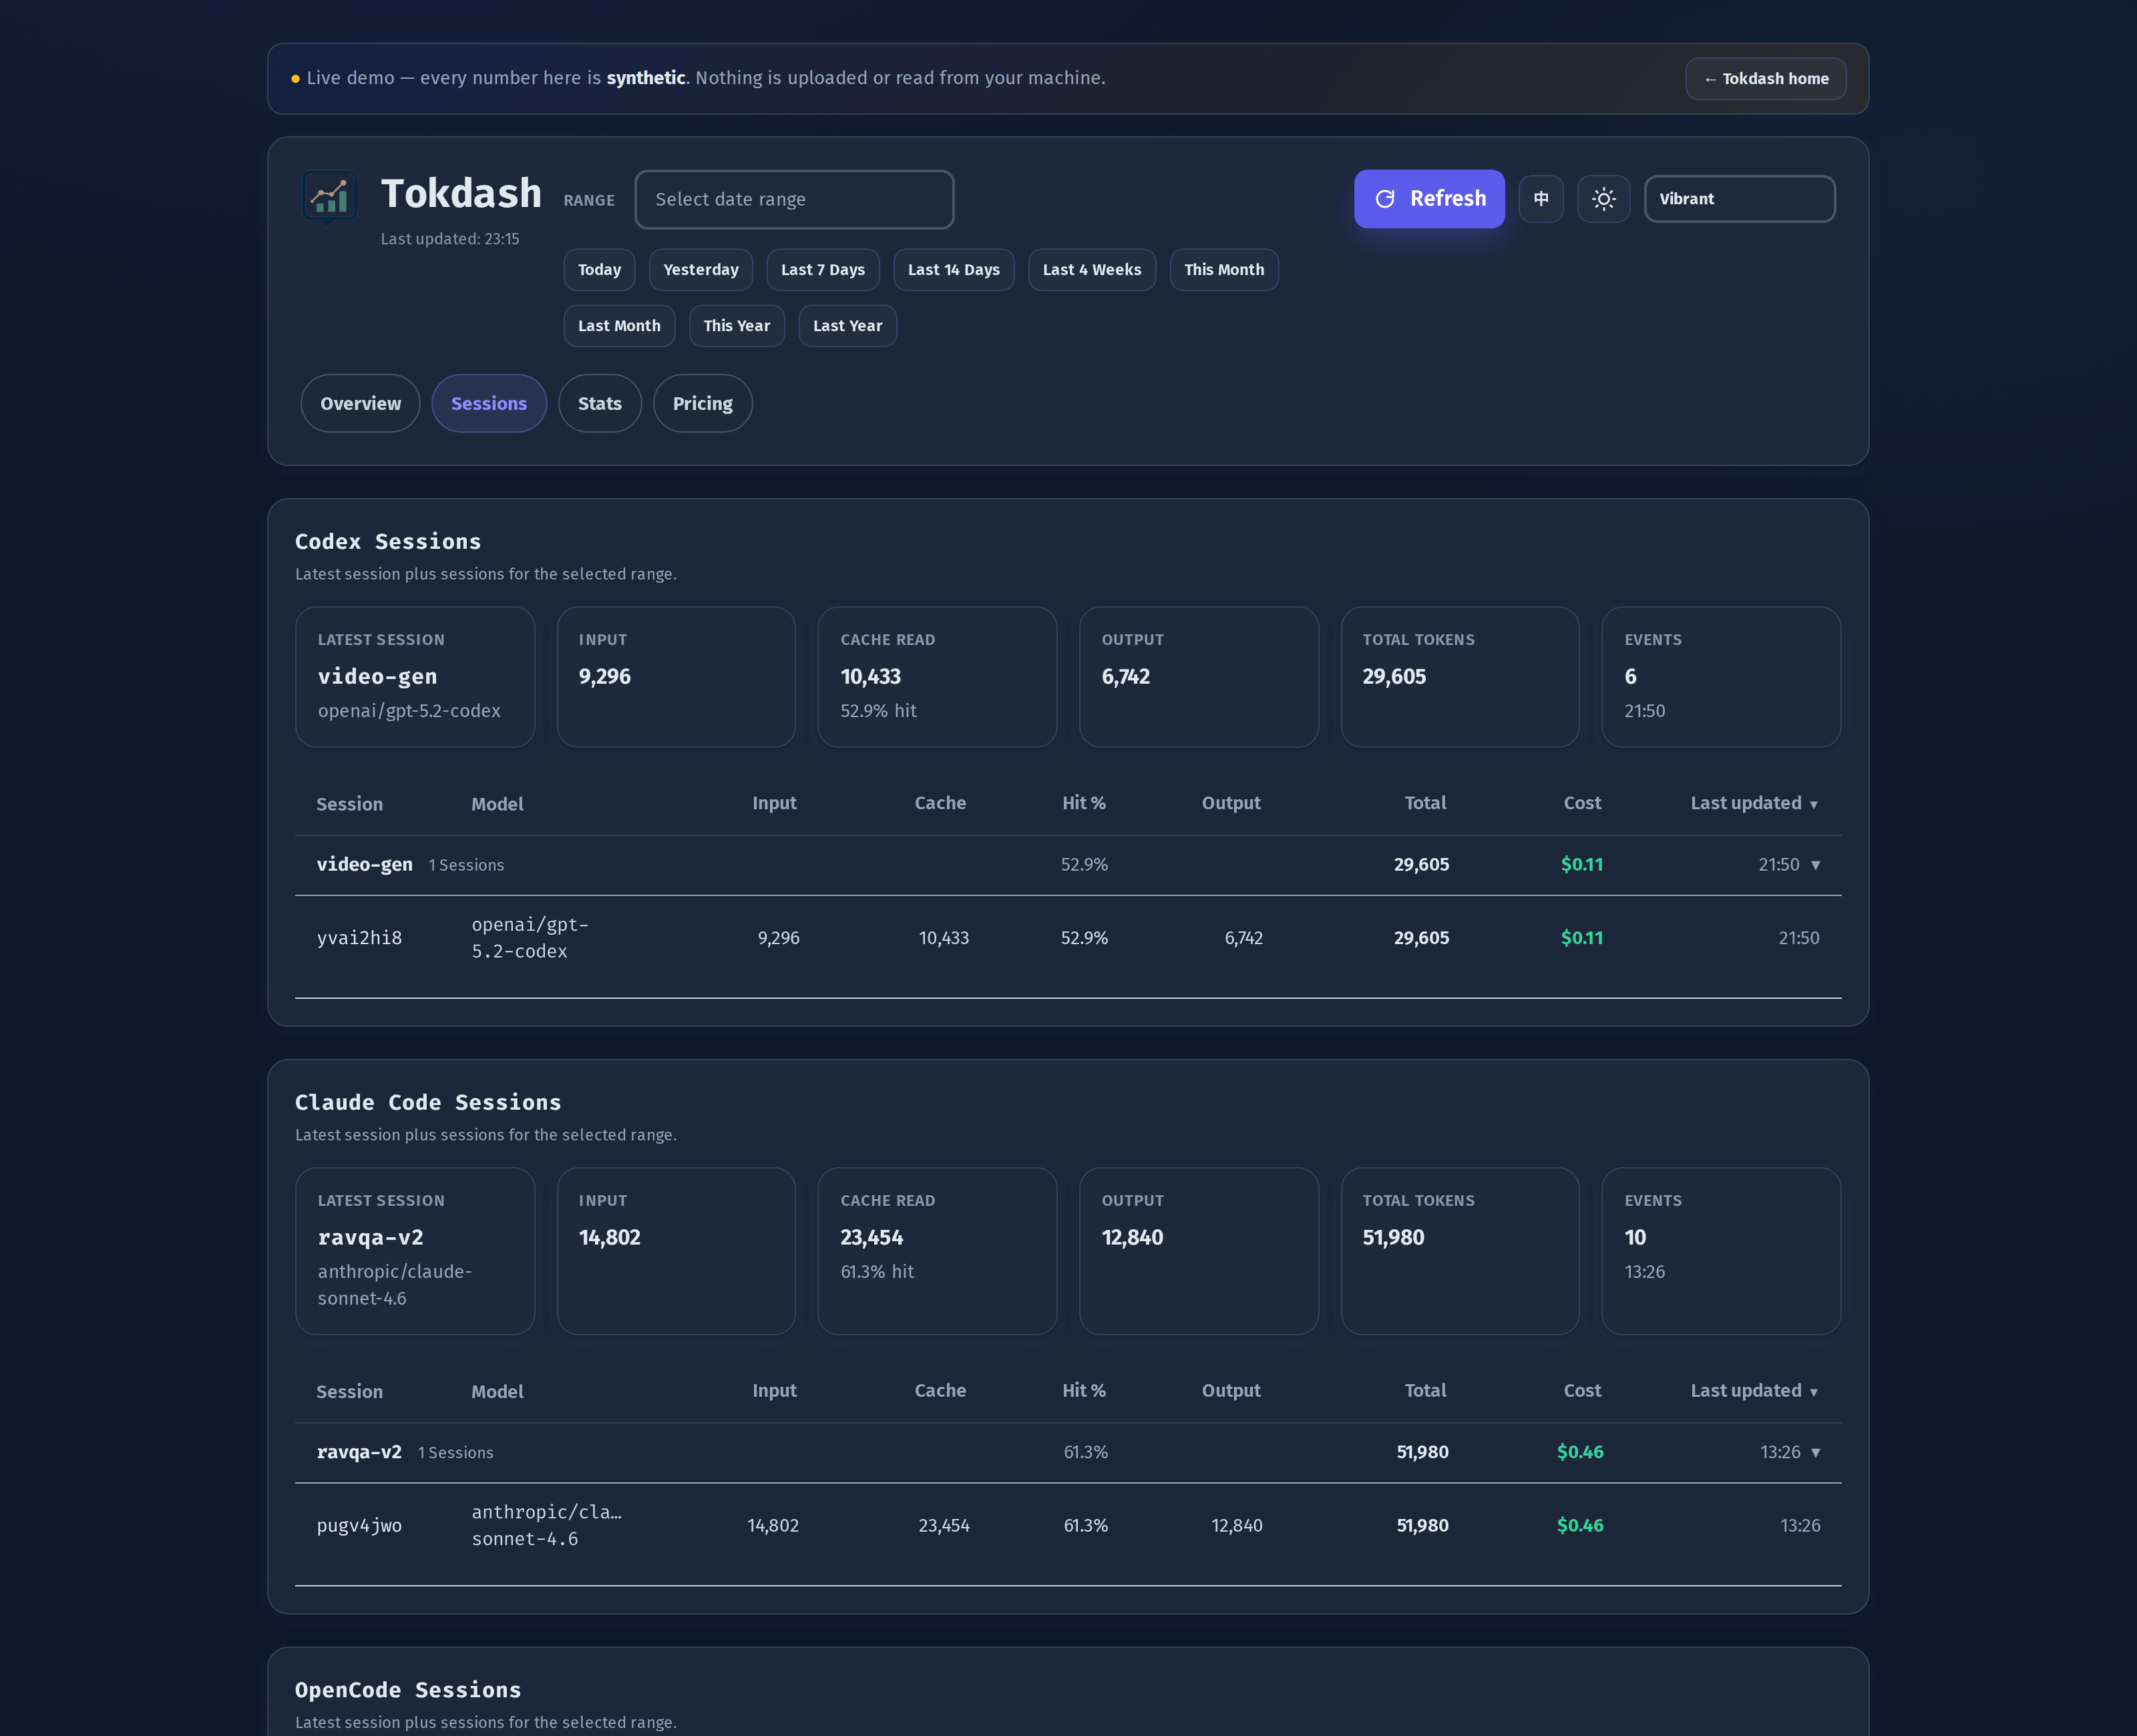
Every row shows Input, Cache, Hit %, Output, Total, Cost, and Last Updated. Codex auto-permission review sessions are hidden by default with a one-click toggle to show them, and Pi’s session names come from session_info.name when present (otherwise the first user message) instead of the project directory.
The interesting column is Hit %: how much of your input was served from the prompt cache. On long refactors that hit the same context window repeatedly, Hit % climbs above 90% and the effective cost collapses. Seeing that number explicitly — per session, per model — is the kind of feedback loop that changes how you structure work. It is also where the cache pricing differential shows up: a 95% hit rate on Sonnet 4.6 is a very different bill than the same hit rate on Opus 4.8.
For Codex, Claude Code, OpenCode, and Pi you can click into an individual session to see every model turn, the timestamps, and how cost accumulated across the conversation. That level of detail is what made me stop guessing which agent was expensive and start measuring.
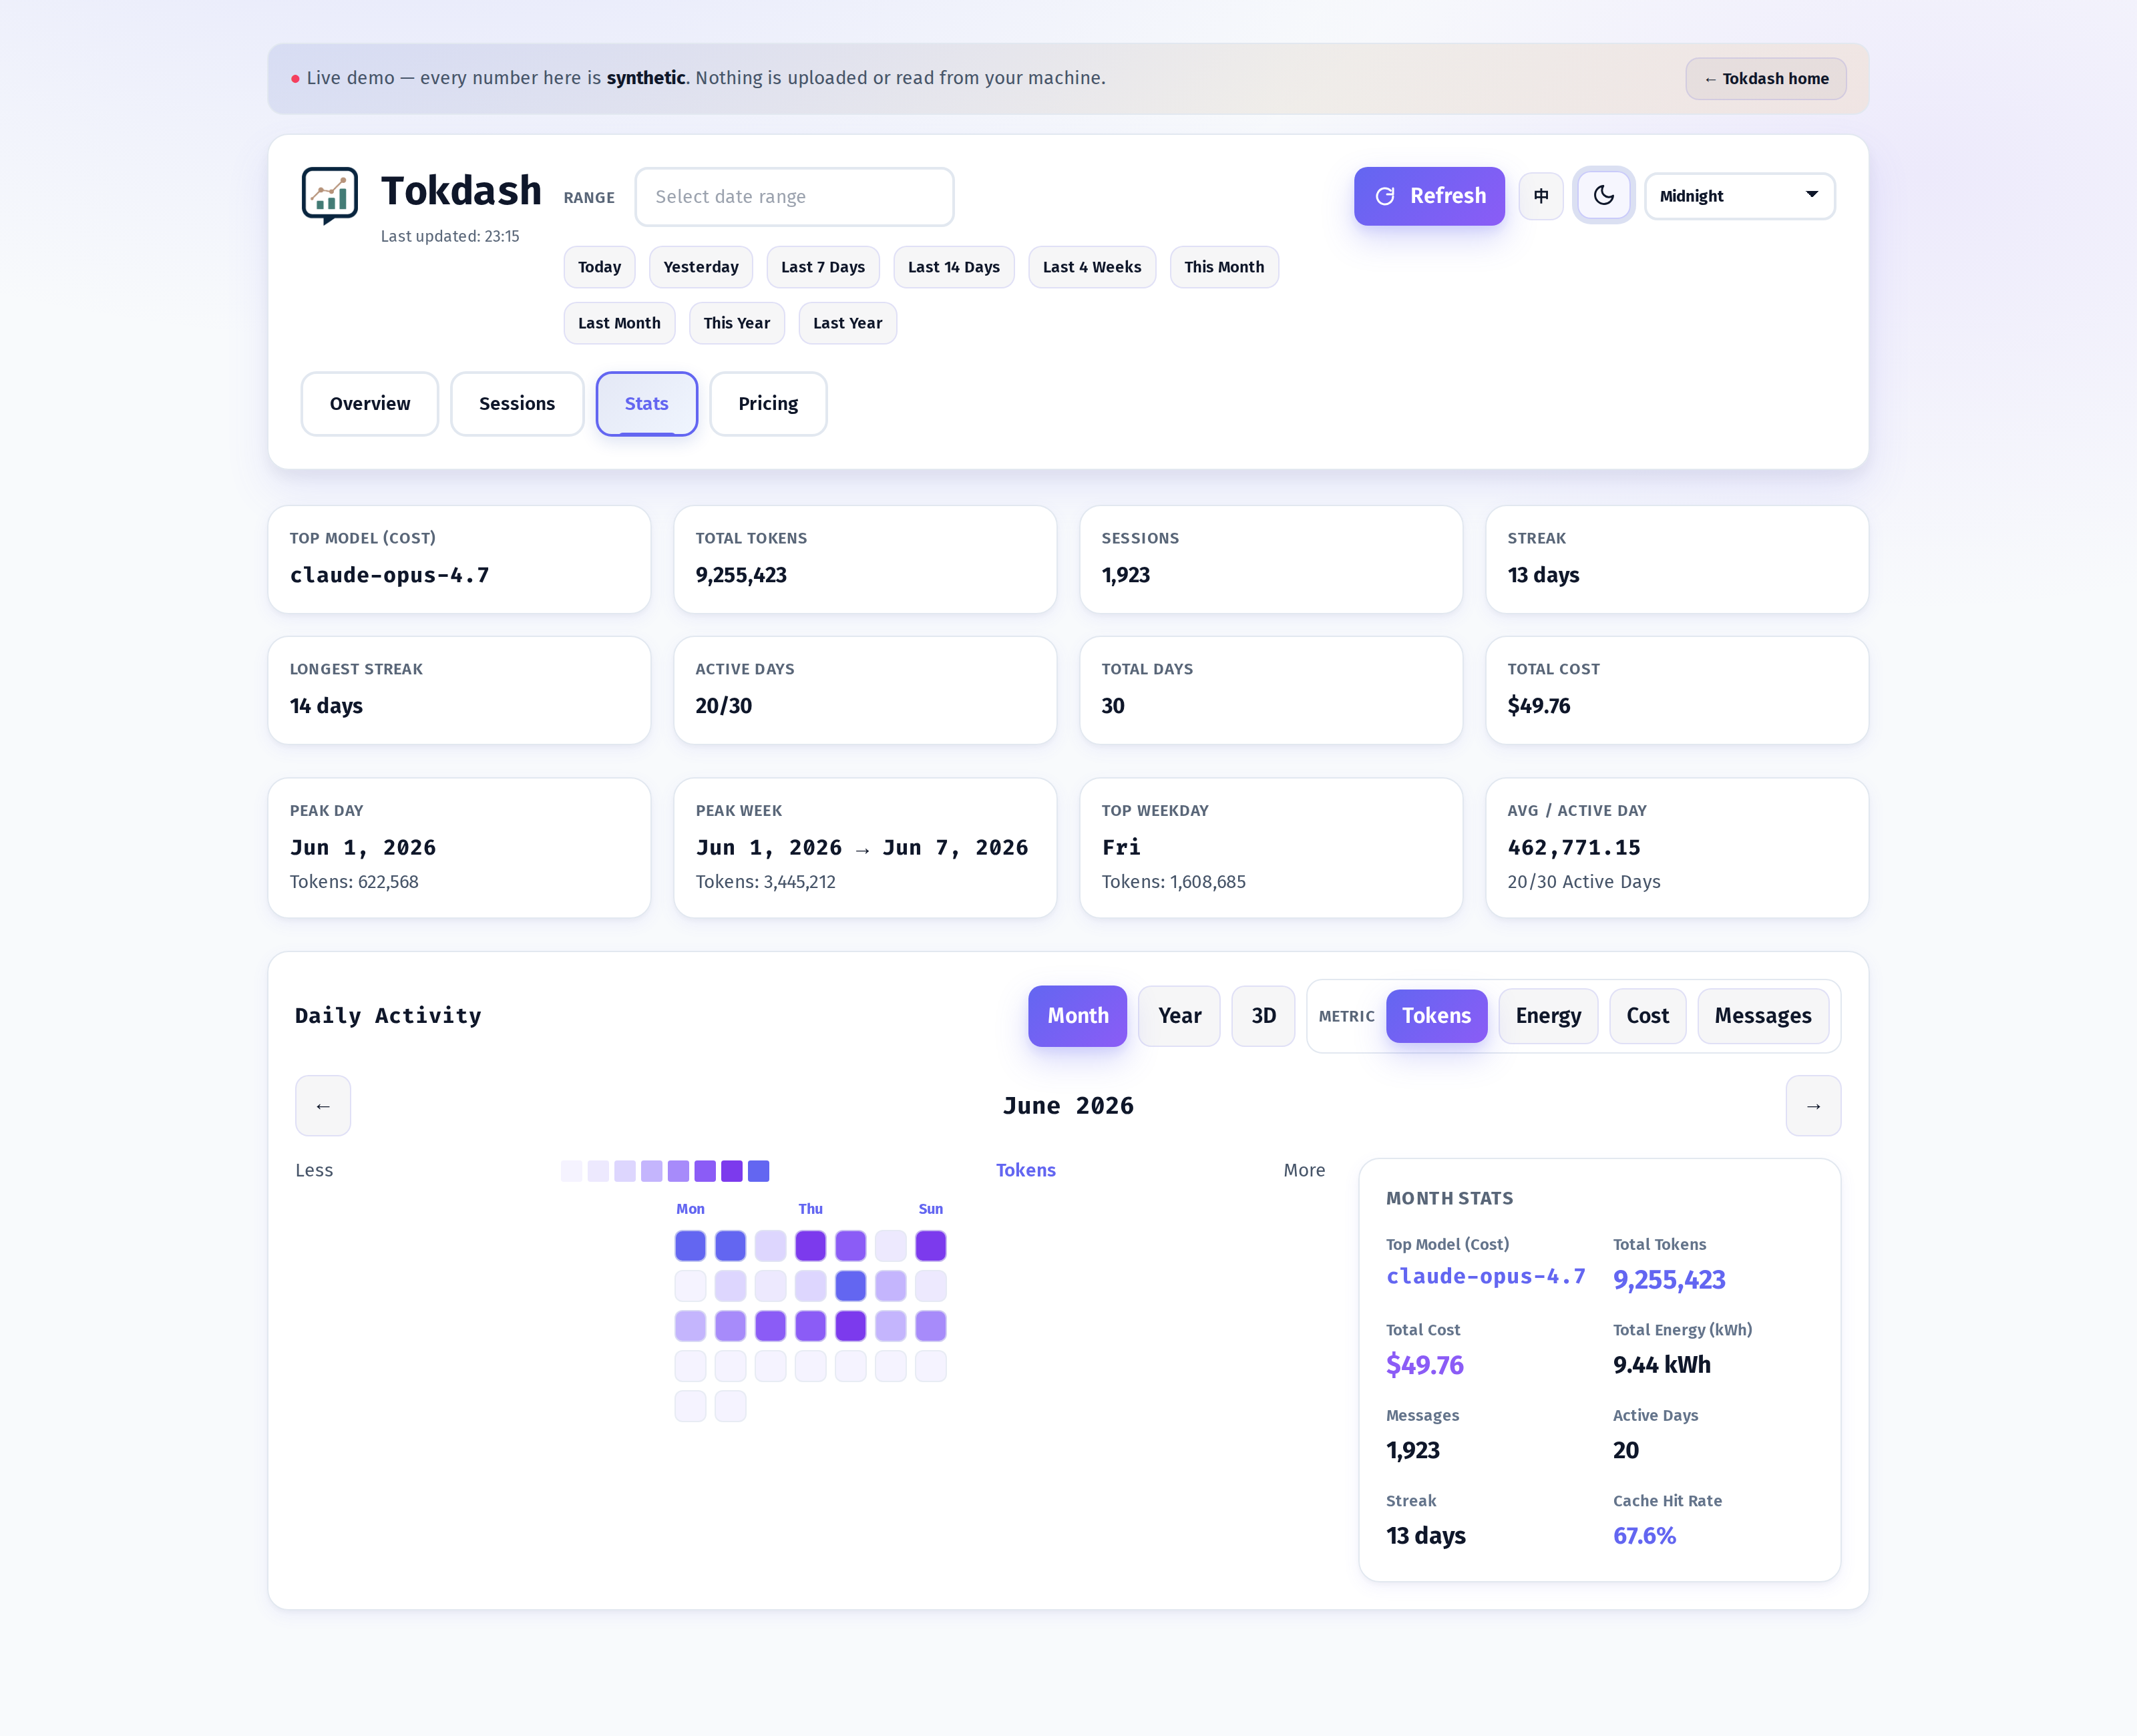
The Stats tab: a 3D contribution calendar
If the Overview is the answer to how much, the Stats tab is the answer to when. It is built around a contribution calendar that you can switch between flat Month / Year / 3D views, and toggle between four metrics: Tokens, Energy (kWh), Cost, Messages.
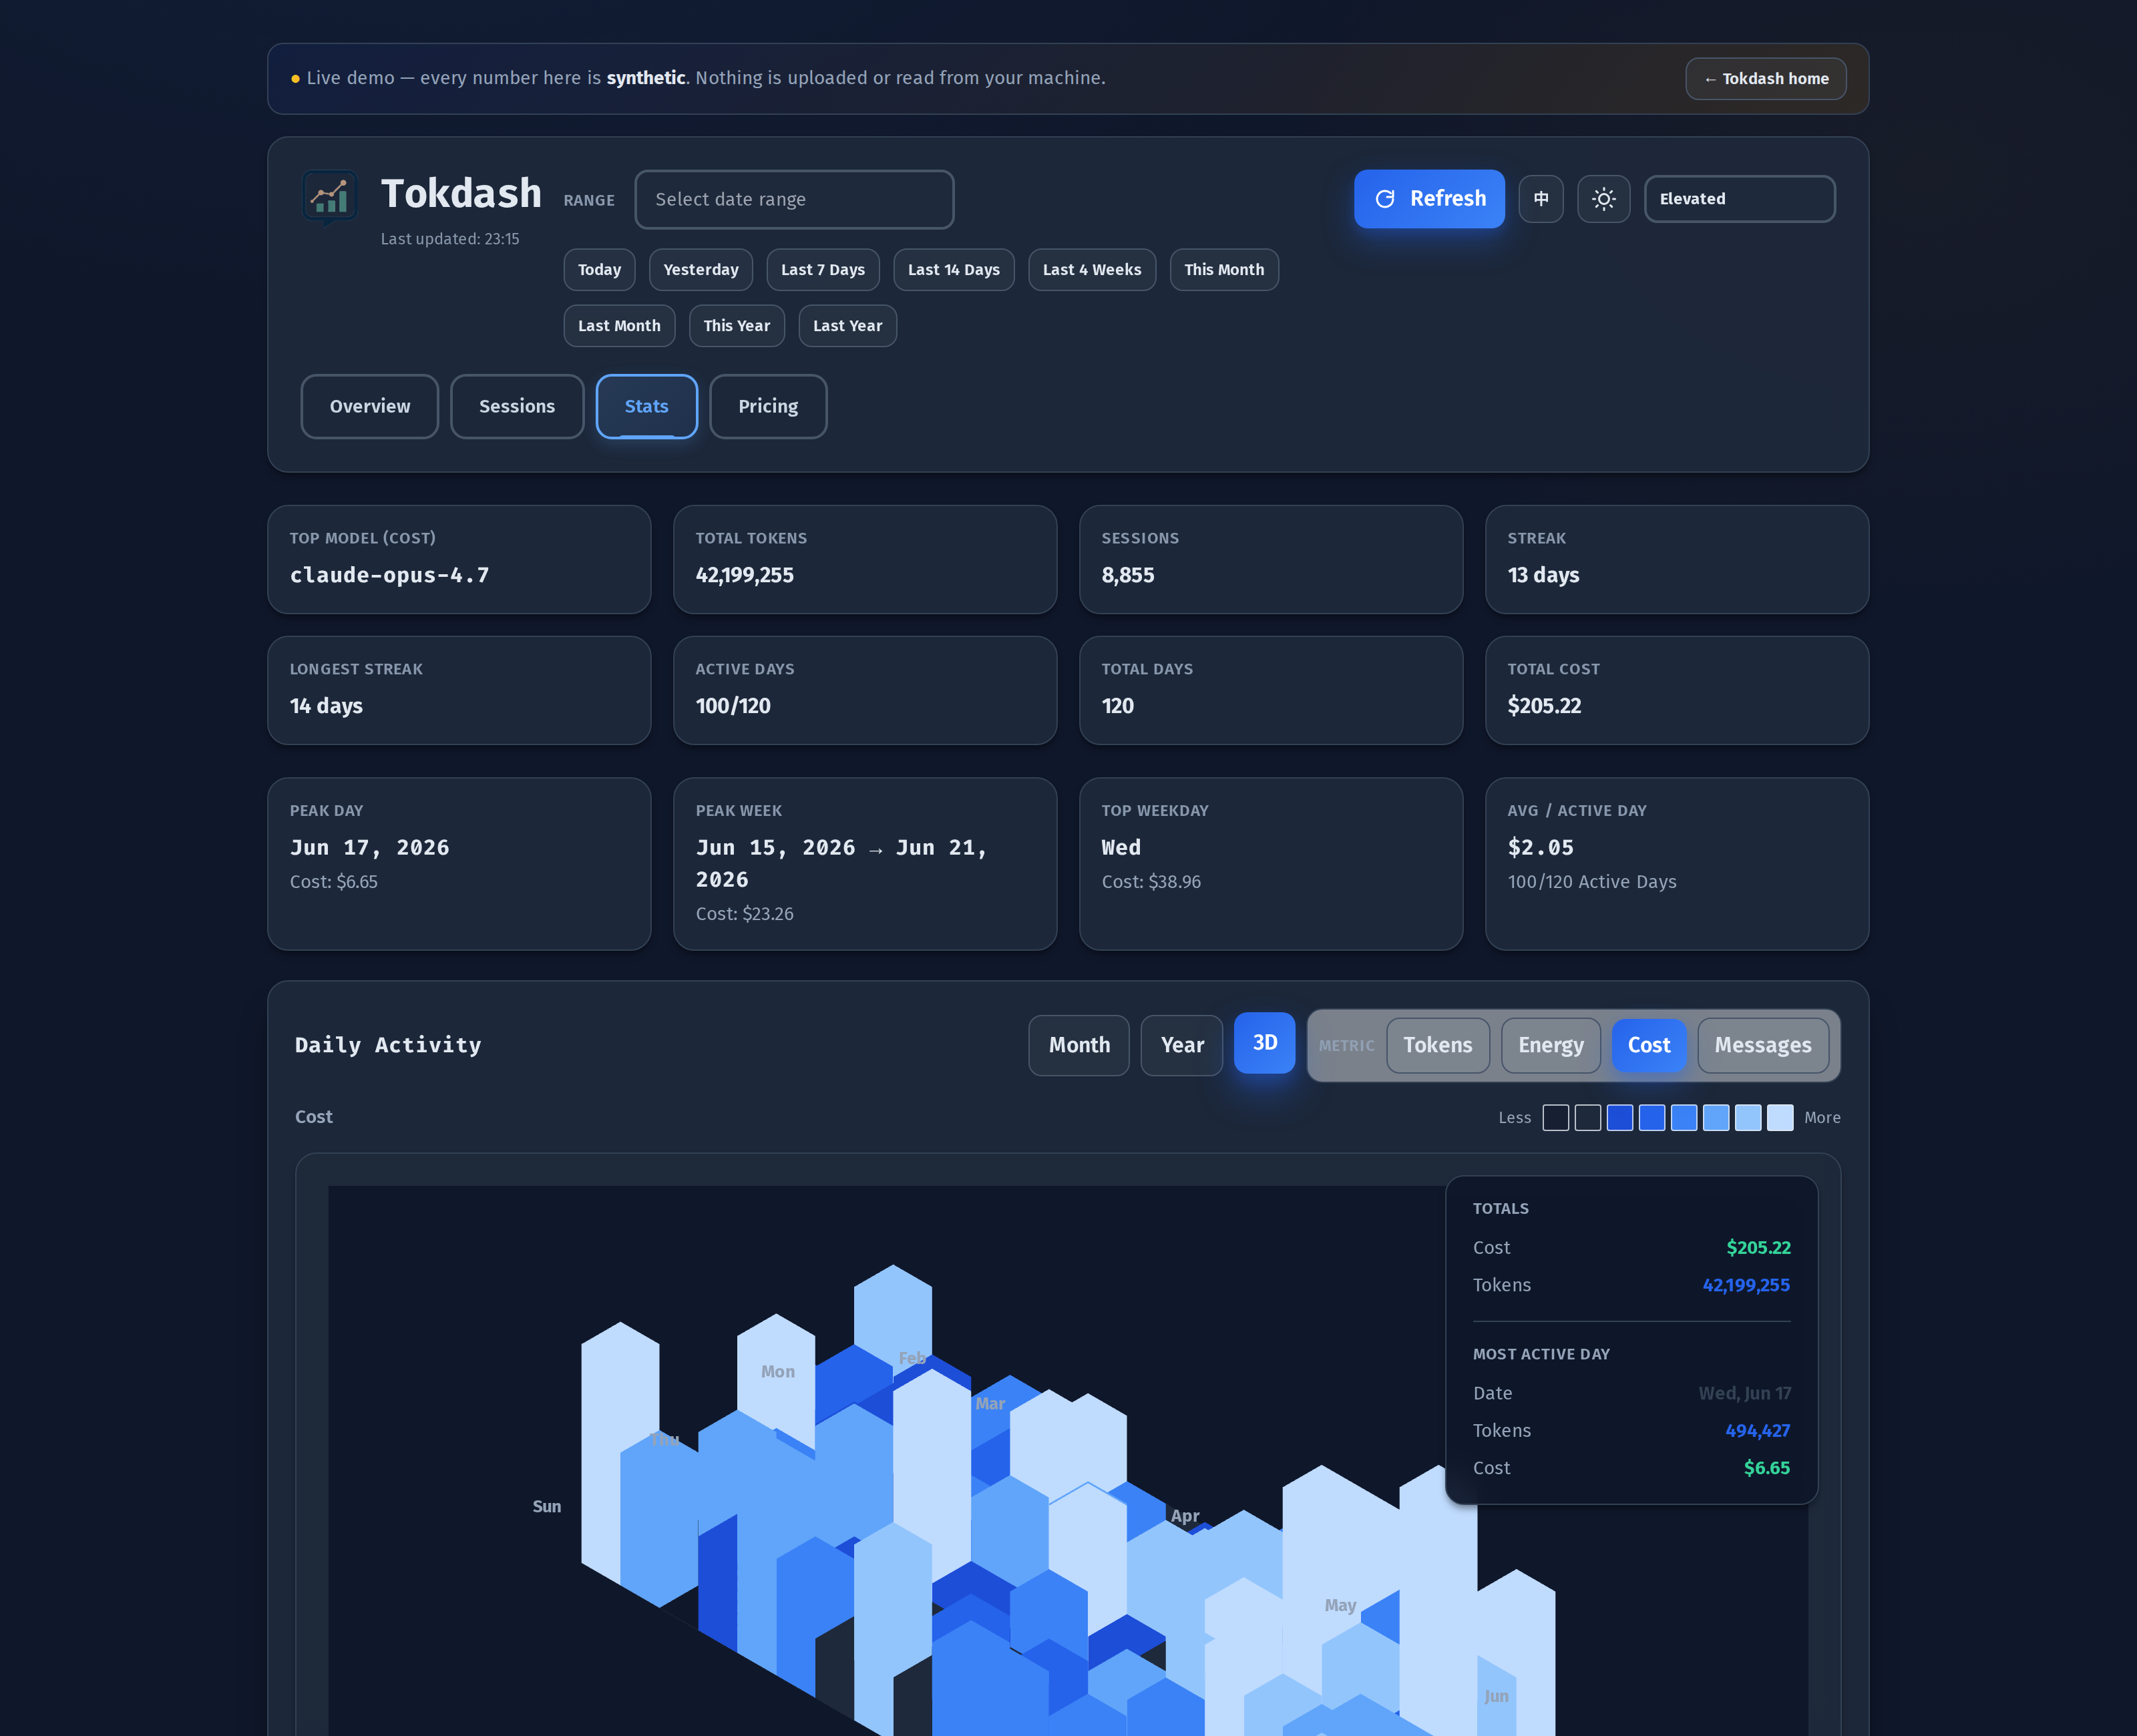
The 3D mode is the one I keep coming back to. Each cube is a day, the height is the value of the metric you picked, and the colour is the same value mapped to the theme’s palette. Click any cube and a Day Details modal opens with the per-tool breakdown for that day. It is the single best way I have found to spot a runaway session — the cube that sticks up a storey above its neighbours is always a story.
The flat Year view, switched to Cost mode, is the view that justifies the whole tool to me. It is the GitHub contribution graph, but for spending, and it makes weekly patterns obvious.
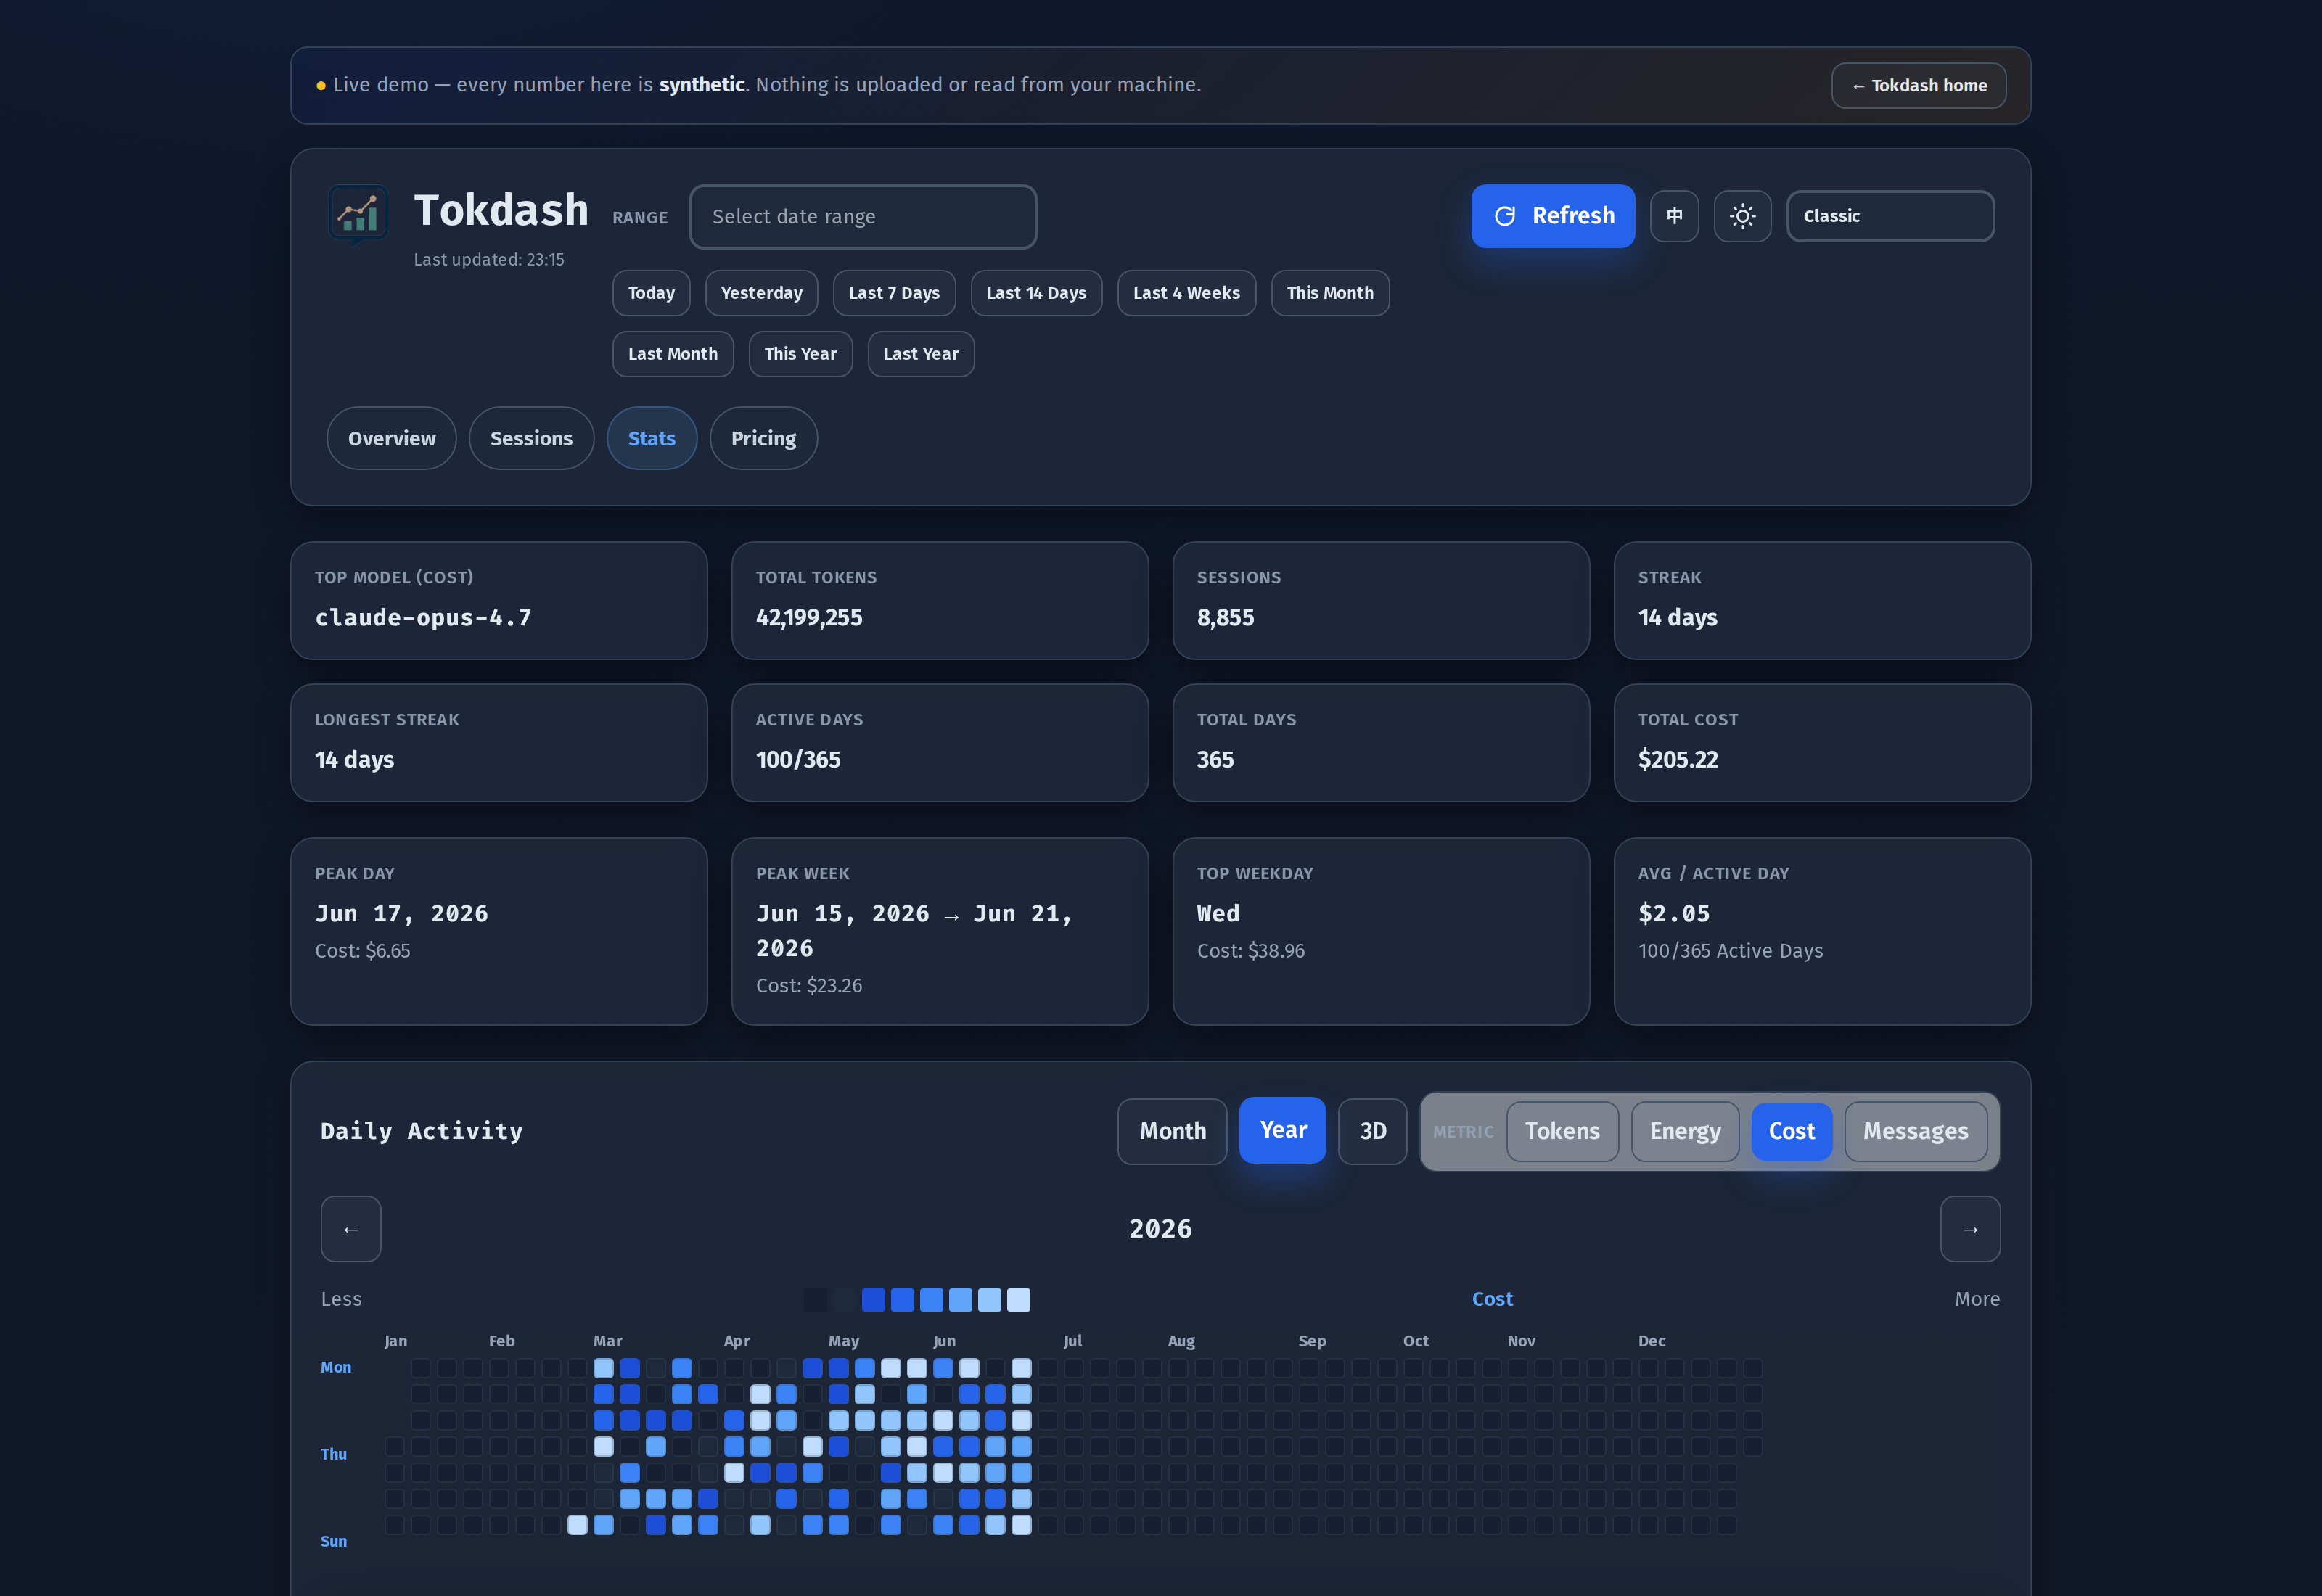
I discovered from staring at this view that my Mondays are roughly 2.3× my Fridays — Mondays are refactor days, Fridays are docstring days. The model is the same on both days; the workload is not.
The Energy metric is the one nobody asked for but everybody should care about. Tokdash estimates energy from a built-in table of per-model-class coefficients — Joules per token for prefill, cache, and decode — and surfaces the result on the same axes as tokens and cost. The numbers are model-class averages, not GPU-specific measurements, so they should be read as orders of magnitude rather than kilowatt-hour invoices — but they change the framing. “I spent $4.20 on Claude today” and “I spent the energy equivalent of charging a laptop for six hours on Claude today” are the same underlying fact, and the second one tends to be the one that changes behaviour.
Themes: ten, including the ones I didn’t expect to like
Tokdash ships ten themes. I assumed theme support was cosmetic; it turned out to be a usability feature, because the right theme depends on what you are looking at.
- Classic — the safe default, useful when you just want to read numbers.
- Elevated — soft cards, subtle shadows, the “looks at home in 2026” choice.
- Vibrant — high-saturation colour blocks; surprisingly good on the Sessions table because adjacent rows stay distinguishable.
- Midnight — dark by default, the theme I actually leave it on. The contribution calendar reads like a city skyline.
- Paper — for printing a screenshot into a slide deck.
- Liquid — glassmorphism, looks great in screenshots, slightly heavy on lower-end laptops.
- Terminal — phosphor green on black, the one I would pick for a long debugging session.
- Brutalist — sharp edges, no shadows, loud contrast.
- Arcade — bitmap-ish accents; fun, not for daily use.
- Studio — neutral greys, the theme for showing the dashboard to someone who has never seen it before.
There is also a light/dark toggle independent of the theme, which means Classic Dark and Elevated Light are both first-class views. The install button for the PWA lives in the header toolbar too, and it auto-hides when the app is already installed or the browser exposes no install prompt (iOS Safari).
The statusline integration: my favourite hidden feature
This is the feature that took me from “I check the dashboard once a day” to “I have a live counter in my terminal at all times.” Tokdash exposes its data over a local HTTP API, and you can wire any of those endpoints into your agent’s statusline. For Claude Code that means a small script that queries http://127.0.0.1:55423/api/usage?period=today and prints a compact token counter on every prompt. Every call is a plain GET against loopback, so it never trips the write-protection gate, and it fails silently — if Tokdash isn’t running, the counter just disappears instead of breaking your prompt.

That screenshot is the full template. Reading it left to right, top to bottom: the model and its context window, the working directory, the git branch, the reasoning effort, and — the part Tokdash adds — today’s total tokens and cost (📊 85.7M ($64.91) today); then a context-window fill bar with the live input/output split, the current session’s cost and elapsed API time, and the rate-limit reset countdown (5h:18% 7d:10%). Everything except the 📊 segment is Claude Code’s own session data; Tokdash just contributes the spend.
As of this week you don’t have to write that script yourself — two ready-made templates ship in docs/examples/statusline/:
statusline-minimal.sh— one line, e.g.[Claude Sonnet 4.6] 📁 myproject | 📊 12.3M ($4.56) today. The best starting point, and switchable to any window withTOKDASH_STATUSLINE_PERIOD(today,week,month,year, …).statusline-full.sh— the four-row dashboard in the screenshot: today and week totals plus a colour-coded top-3-tools breakdown, sitting alongside Claude Code’s own context, cost, and git fields. The Tokdash-specific lines are fenced in a marked block you can keep or delete.
Installing either is a copy plus a settings block:
1
2
3
mkdir -p ~/.claude/scripts
cp docs/examples/statusline/statusline-minimal.sh ~/.claude/scripts/statusline.sh   # or statusline-full.sh
chmod +x ~/.claude/scripts/statusline.sh
1
2
3
4
5
6
7
8
// add to ~/.claude/settings.json
{
  "statusLine": {
    "type": "command",
    "command": "bash ~/.claude/scripts/statusline.sh",
    "refreshInterval": 30
  }
}
refreshInterval (Claude Code 2.1.97+) is the detail that turns it into a real feedback loop instead of a turn-end report: the bar re-runs the script every 30 seconds, so the numbers keep ticking even while you sit and read.
The point is not the visual; the point is the feedback loop. When you can see that the last few turns burned 248k input tokens because you kept re-pasting a 50k-token file, you stop re-pasting the file. When today’s spend is sitting in your peripheral vision, you stop restarting the session every twenty turns out of habit. The dashboard tells you about the problem tomorrow; the statusline tells you about the problem while you can still do something about it.
The API is the same one the dashboard uses, so any endpoint is fair game — total tokens today, cost this week, a per-model breakdown, a per-tool breakdown, even a cache hit rate (every by_tool entry carries one). If your agent can run a curl and print the result, it can show the number. The full schema is in docs/API.md, and the folder README has the install, config, and troubleshooting notes.
The Pricing tab (now with user-override persistence)
The Pricing tab is a read-only view of the local pricing database, with Reload / Format / Save controls for editing rates locally. As of v1.0, those edits persist to a user override at ~/.tokdash/pricing_db.json instead of mutating the packaged baseline — so they survive tokdash update and a pip reinstall, and they work on read-only installs.
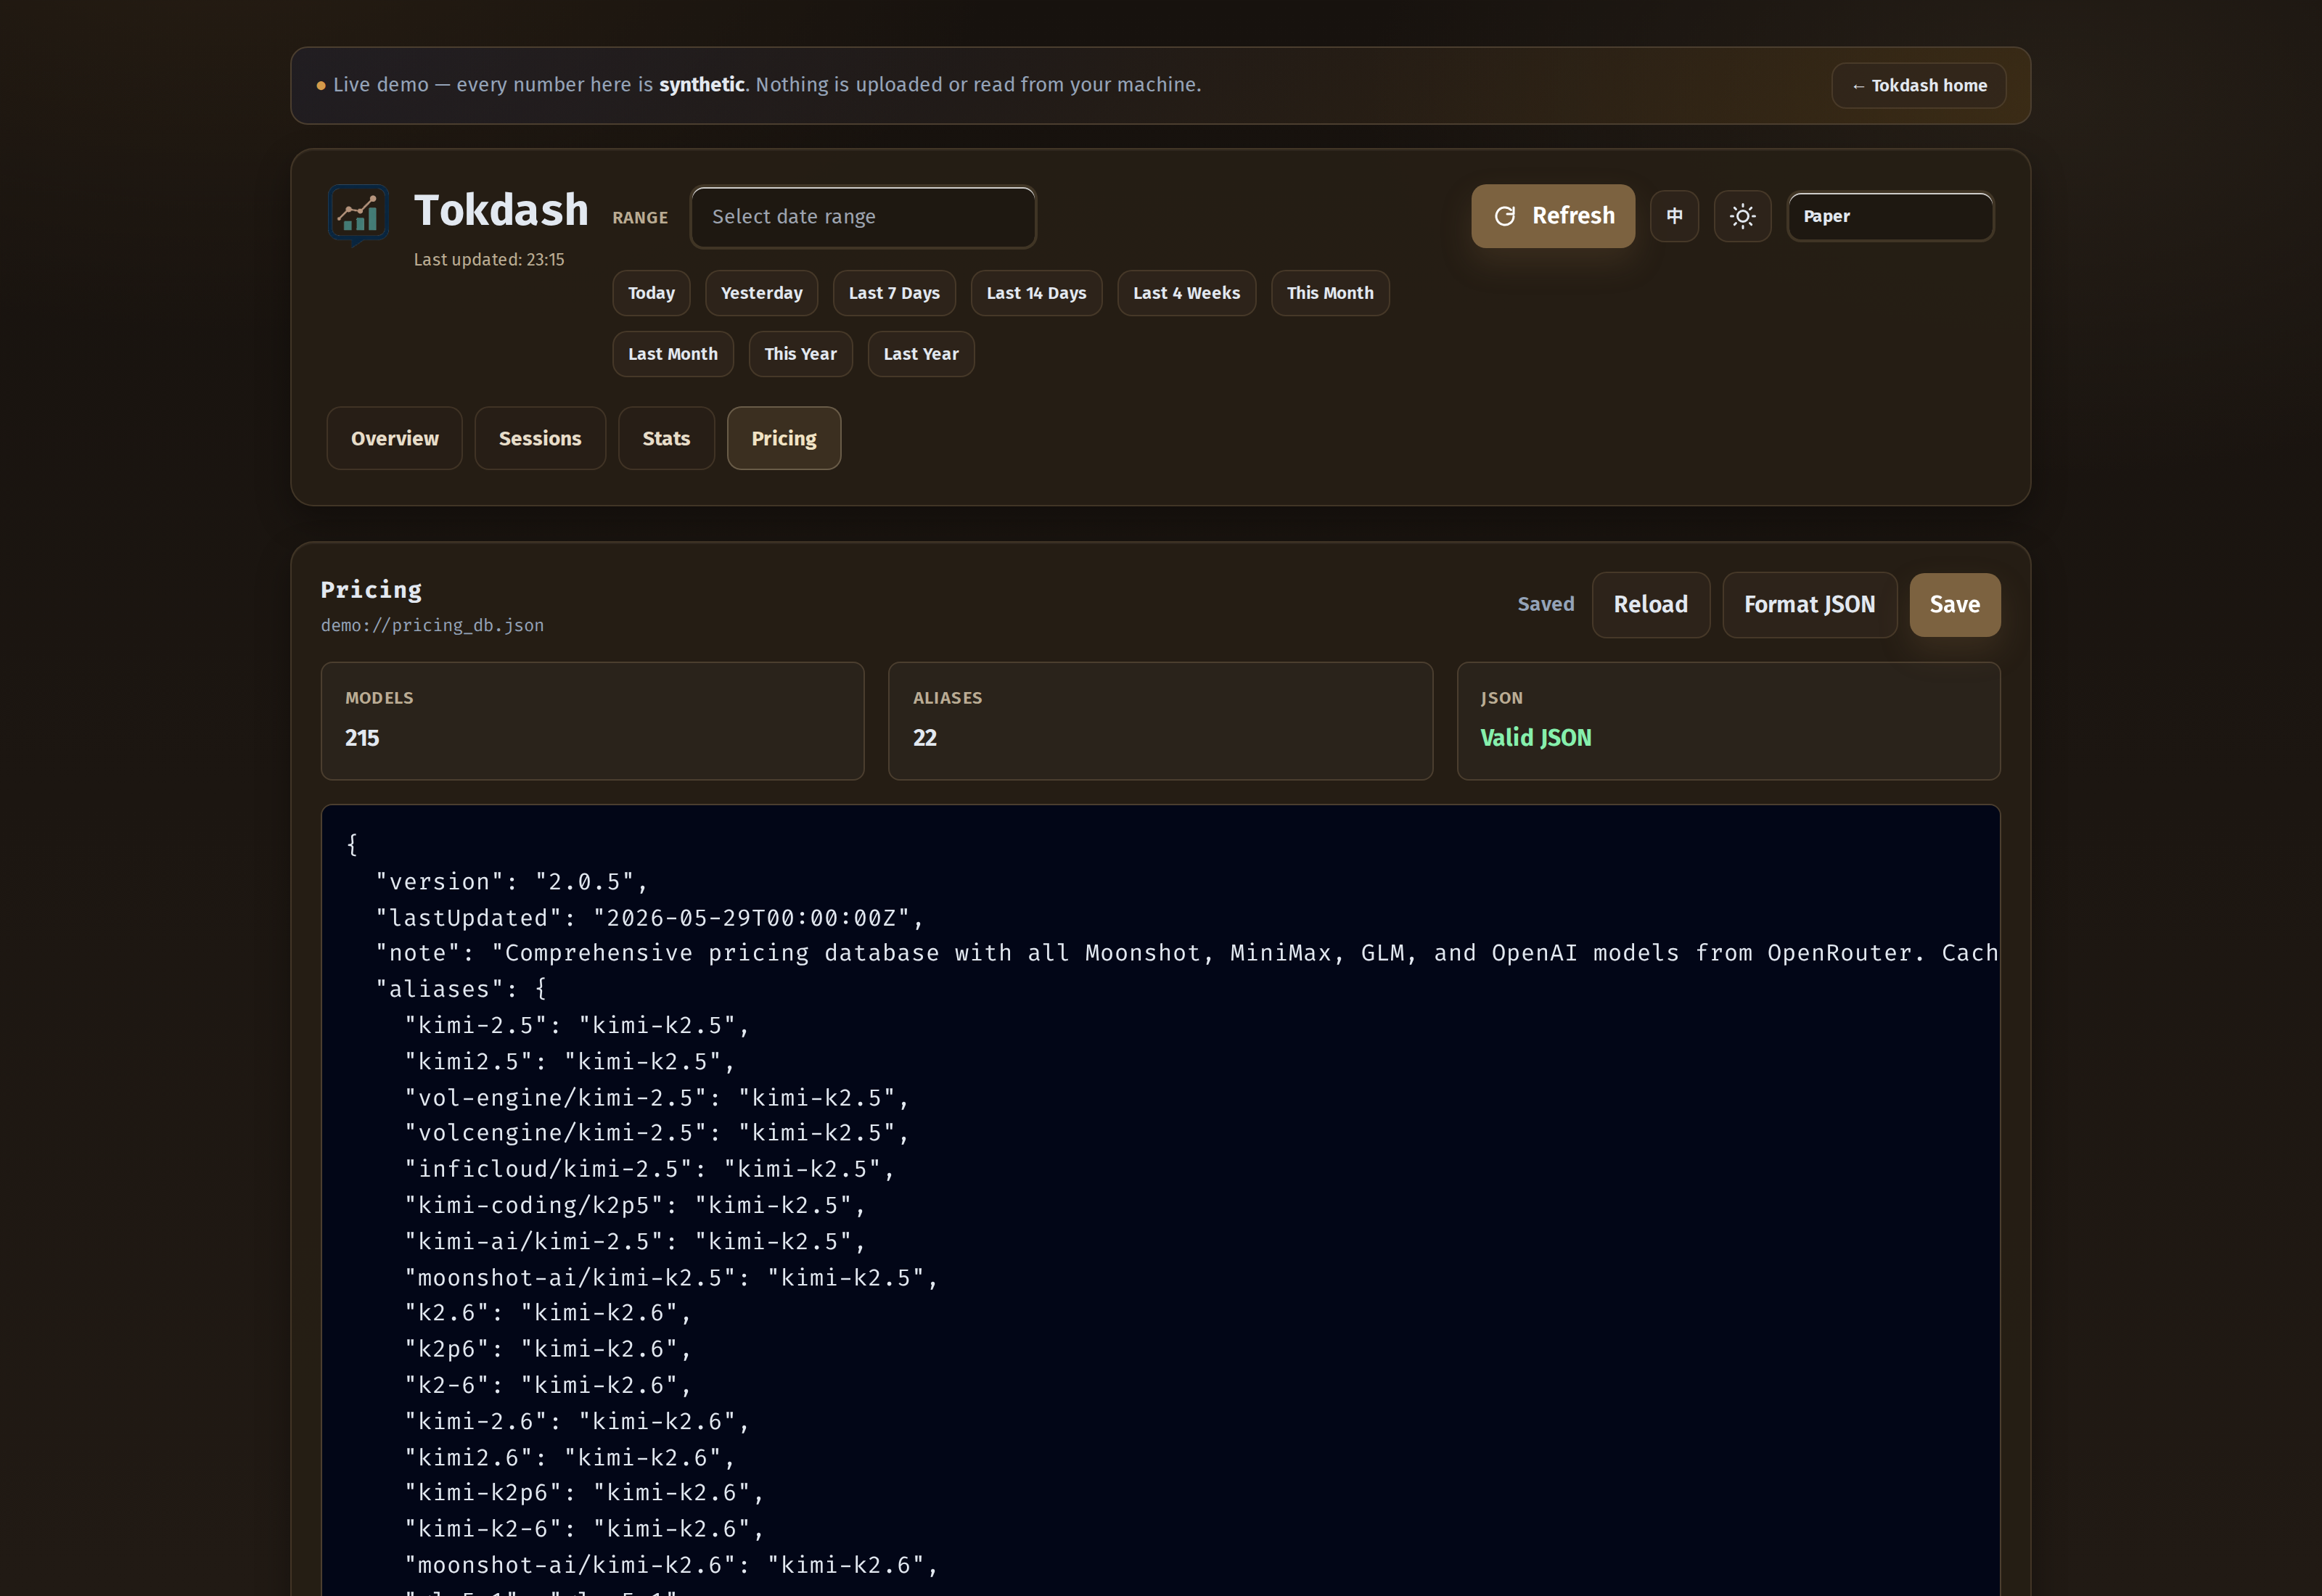
The override is WYSIWYG: deletions stick, and a missing or corrupt override falls back to the shipped baseline. v1.0 also fixed the cache-invalidation race — pricing edits now correctly invalidate the API response cache, the coding-tools and OpenClaw cost caches, the session pricing, and the persistent usage store, so edited rates take effect immediately across Overview/Usage/Tools instead of being silently masked by stale data.
The pricing database is the one place where Tokdash is honest about being an estimate. Real provider pricing changes faster than a JSON file can keep up, so the README has a Cost Accuracy Note that says so plainly, and the Pricing tab exposes the file so you can patch it locally. If your billing source disagrees with what Tokdash shows, the fix is one JSON edit and a Reload click.
Why it stays fast: a local SQLite usage index
The thing I underestimated before I started using Tokdash was how often I actually reload the dashboard. The first version I tried had to reparse every log file on every refresh, which was fine for a week of history and embarrassing for six months. v0.6.0 added a local SQLite index (~/.tokdash/usage.sqlite3) that caches parsed rows, with a strict source-of-truth fallback to live parsing if the index is unavailable.
The result, per the v0.6 release notes, is roughly 30× faster cold scans than pre-0.6, and 15× faster than ccusage on the same hardware in the same local benchmark. The first number is the one I care about — reloading the dashboard with a year of history open now takes a fraction of a second, which is the difference between “I will just check this” and “I will check this tomorrow.”
The DB is also inspectable and rebuildable. New in v0.6:
1
2
3
4
5
6
tokdash db status --pretty
tokdash db sync --pretty
tokdash db verify --verify-period today --pretty
tokdash db repair --dry-run --pretty
tokdash db resync --pretty
tokdash db watch --pretty        # or TOKDASH_USAGE_DB_WATCH=1 inside `tokdash serve`
There are also concurrency knobs (TOKDASH_COMPUTE_CONCURRENCY, TOKDASH_LIMIT_CONCURRENCY, TOKDASH_KEEPALIVE) for the cases where you actually do want to hammer the server, plus a single-flight stale-while-revalidate cache that collapses concurrent refreshes for the same stale key into one compute and serves the last good value to readers — so a burst of cold requests no longer stampedes the parser. Cold misses over the cap now return 503 quickly instead of queuing inside worker threads. The defaults are sane; the knobs exist.
What it does not do
A few things Tokdash deliberately does not do — worth saying out loud:
- It does not talk to the providers. Token counts come from the local session logs the clients already write. Costs come from a local JSON file (with a user override on top in v1.0). Nothing is uploaded.
- It does not control your agents. It is read-only on the agent side. There is no “stop spending” button, and there shouldn’t be — that’s the agent’s job, and it should be your decision, not the dashboard’s.
- It does not fix history retention. Claude Code and Gemini CLI delete sessions older than ~30 days by default, which means Tokdash’s earlier months can quietly shrink. The README has the one-line config fix per client, and there is an in-app reminder on every
tokdash serve. If you’d rather Tokdash keep its own snapshot, that design is parked — seedocs/ROADMAP.md— and the current bet is on per-client retention config rather than a parallel store. - It does not auto-upgrade. Even with the v1.0 update check enabled,
tokdash doctoronly reports. Upgrades are an explicittokdash update.
Try it
The fastest path is the live demo, which is the unmodified Tokdash frontend against an in-browser shim that returns deterministic synthetic data. You can switch tabs, pick any date range, toggle all ten themes, and drill into a synthetic Codex / Claude Code / OpenCode / Pi session — no install, no server, no signup:
- Live demo: tokdash.github.io/demo
- Project home: tokdash.github.io
- Repo: github.com/JingbiaoMei/Tokdash
If you want to point it at your own sessions, the install is now two lines:
1
2
3
pipx install tokdash
tokdash setup
# open the URL it prints (default http://127.0.0.1:55423)
For scripts and bundlers, the supported contract is tokdash setup --auto --json. To see what setup would change without applying it: tokdash setup --dry-run. To verify after the fact: tokdash doctor. To upgrade: tokdash update. To remove everything (history preserved by default, --purge to wipe): tokdash uninstall.
If you want a statusline counter in Claude Code (or any agent that can hit a local HTTP endpoint), the fastest path is to copy one of the ready-made templates from docs/examples/statusline/ — statusline-minimal.sh for one line, statusline-full.sh for the four-row dashboard. The API reference is in docs/API.md, and if you’d rather roll your own, the prompt to hand your coding agent is literally one sentence:
“Add a statusline item from the tokdash endpoint’s API; it should show the total tokens used today.”
If you build something with Tokdash, or find a metric you wish it surfaced, open an issue. The roadmap is in docs/ROADMAP.md and the bar for a PR is low — most of the dashboard is one src/tokdash/static/index.html and one set of FastAPI routes in src/tokdash/api.py. The next feature I want is per-prompt cost breakdowns inside a single session; if someone else writes it first I will buy them a coffee.
Jingbiao Mei is a final-year PhD student at the University of Cambridge’s Machine Intelligence Lab, working on multimodal retrieval, agent systems, and the kind of tool-usage problems that only show up after the third coding agent is on the machine at the same time. He is the creator of Tokdash, ATM-Bench, FLMR, PreFLMR, and ExPO-HM.
Comments