Contents
Summary
-
ROC Curves summarize the trade-off between the true positive rate and false positve rate for a predictive model using different probability thresholds.
-
Precision-Recall curves summarize the trade-off between the true positive rate and the positive predictive value for a predictive model using different probability thresholds.
-
ROC curves are appropriate when the observations are balanced between each class, whereas precision-recall curves are appropriate for imbalanced datasets.
- ROC curves would be great for general tasks
- precision recall solves for imbalanced prediction, say if our training set only has 1% of positive data, then a model that predicts negative all the time would receive 99% accuracy. However, this model is a bad model, precision-recall is here to save.
ROC curves
Receiver Operating Characteristic curve is a plot of the false positive rate (x-axis) versus the true positive rate (y-axis) for a number of different threshold values between 0 and 1.
True Positive Rate
The true positive rate is calculated as the number of true positives divided by the sum of the number of true positives and the number of false negatives. It measures how good the model is predicting the positive classes when the actual output should be positive.
TPR = TP / (TP + FN)
Sensitivity is the same as true positive rate
sensitivity = TPR
False Positive Rate
The false positive rate measures how a positive class is predicted when the actual outcome should be negative.
FPR = FP / (FP + TN)
FPR is also referred as the inverted Specificity, as Specificity is defined as:
Specificity = TN / (FP + TN)
Therefore,
FPR = 1 - Specificity
Usage of ROC curve
- The curves of different models can be compared directly in general or for different thresholds
- The area under the curve AUC can be used as a summary of the model skill
Indication from the curve
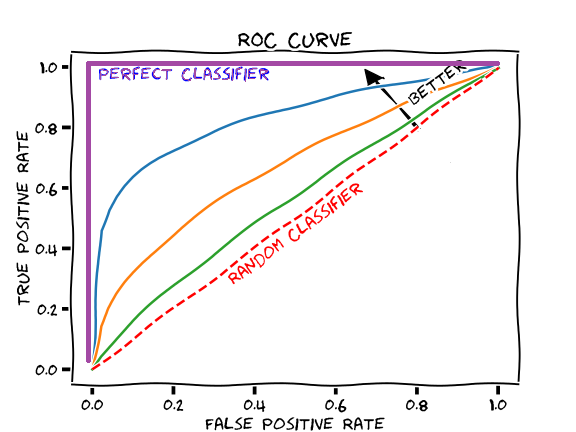
- Smaller values on the x-axis of the plot indicate lower false positives and higher true negatives
-
Larger values on the y-axis of the plot indicate higher true positives and lower false negatives
- A skillful model will assign a higher probability to a randomly chosen real positive occurrence than a negative occurrence on average.
- More skillful model are curves that bow up to the top left of the plot.
- A model with no skill is represented at point (0.5,0.5) as shown on the graph
- A model with perfect skill is represented at a point (0,1) as shown on the graph
Precision-Recall curves
A precision-recall curves is a plot of the precision (y-axis) and the recall (x-axis) for different value of thresholds.
Precision
Precision is the ratio between the number of true positives and the sum of the true positives and false positives. It measures how good the model predicts the positive class.
precision = TP / (TP + FP)
Recall
Recall is the ratio between the number of true positives and the sum of the true positives and false negatives. Recall is the same as sensitivity.
recall = TP / (TP + FN)
F1 score
F1 = 2 * precision * recall / (precision + recall)
Comments